


Running Individual Tests
The TDR Test
4
4-11
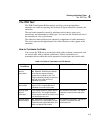
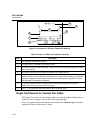
TDR Results Screen
When the TDR test is complete, the TDR results screen appears. Table 4-5
describes the items on the screen.
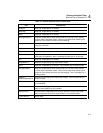
Table 4-5. Items on a TDR Results Screen (Twisted Pair Results)
Item Description
Pair The cable pair relevant to the results. Not shown for coaxial cable results.
Distance The first distance is the measured distance from the test tool to the end of the
cable. The second distance, if shown, is the distance from the test tool to the
beginning of the largest anomaly that caused a reflection greater than the
limit defined by the selected test standard.
Peak The percentage of the test signal reflected at the peak of the anomaly.
# View Plot Press to see a plot of the locations and reflection percentages of the
impedance anomalies detected.
Note
It is possible for impedance anomalies to be detected when testing
from one end of the cable, but not from the other end. This
discrepancy is caused by attenuation of the signal reflections
returning from the anomaly.
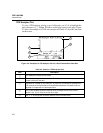
TDR Plot Screen
To view the TDR plot for a cable pair, use D U to highlight one of the pairs;
then press #View Plot to see the plot screen for that pair. Figure 4-3
shows an example of a TDR plot and Table 4-6 describes the items on the plot.