


DSP-100/2000
Users Manual
4-8
TDX Analyzer Plot
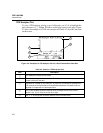
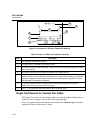
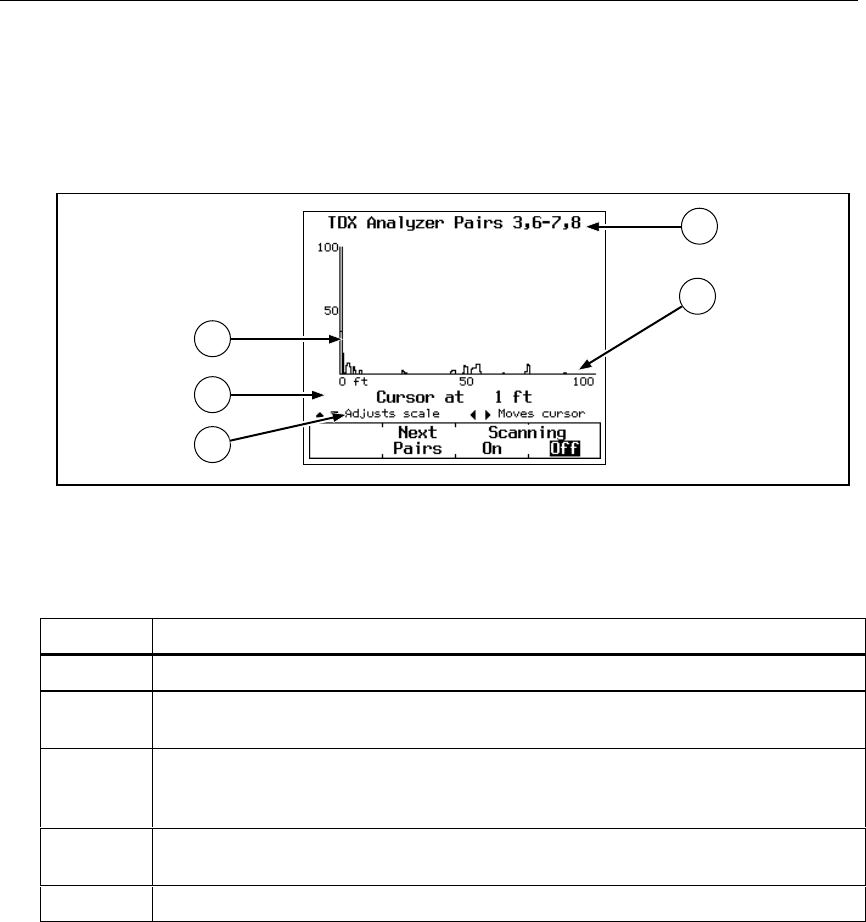
To view a TDX analyzer plot for a set of cable pairs, use D U to highlight the
pairs, then press #View Plot to see the plot screen for the pairs. Figure
4-2 shows an example of a TDX analyzer plot and Table 4-3 describes the items
on the screen.
1
2
3
4
5
gc20c.eps
Figure 4-2. Example of a TDX Analyzer Plot for a Good Twisted Pair Cable Run
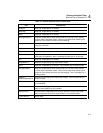
Table 4-3. Items on a TDX Analyzer Plot
Item Description
1 The cable pairs relevant to the results.
2 The distance along the cable under test. The 0 at the left of the scale represents the
location of the main test tool.
3 Magnitude of crosstalk on the cable pair. A peak over 50 indicates a crosstalk level
that exceeds the limit specified by the selected test standard. Crosstalk levels are
adjusted to compensate for cable attenuation.
4 The Cursor Readout shows the distance to the crosstalk source at the cursor’s
position. Use L R to move the cursor left or right.
5 Use D U to change the maximum distance of the horizontal scale.