


Basic Cable Testing
Troubleshooting Basics
7
7-25
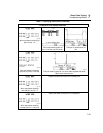
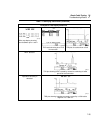
Table 7-1. Identifying Cable Faults (continued)
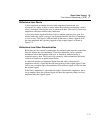
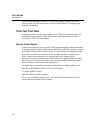
Examples of Test Displays and Plots
gc63i.eps
Wire map display showing
short between pins 1 and 2.
gc64i.eps
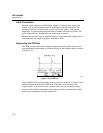
TDR results showing short 78 ft
from test tool.
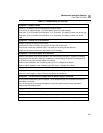
gc65i.eps
TDR plot of results shown at left.
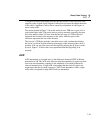
NEXT test fails.
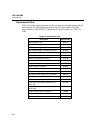
gc66i.eps
TDX plot showing NEXT caused by excessive untwisting of cable
pair at far-end connector.
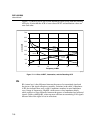
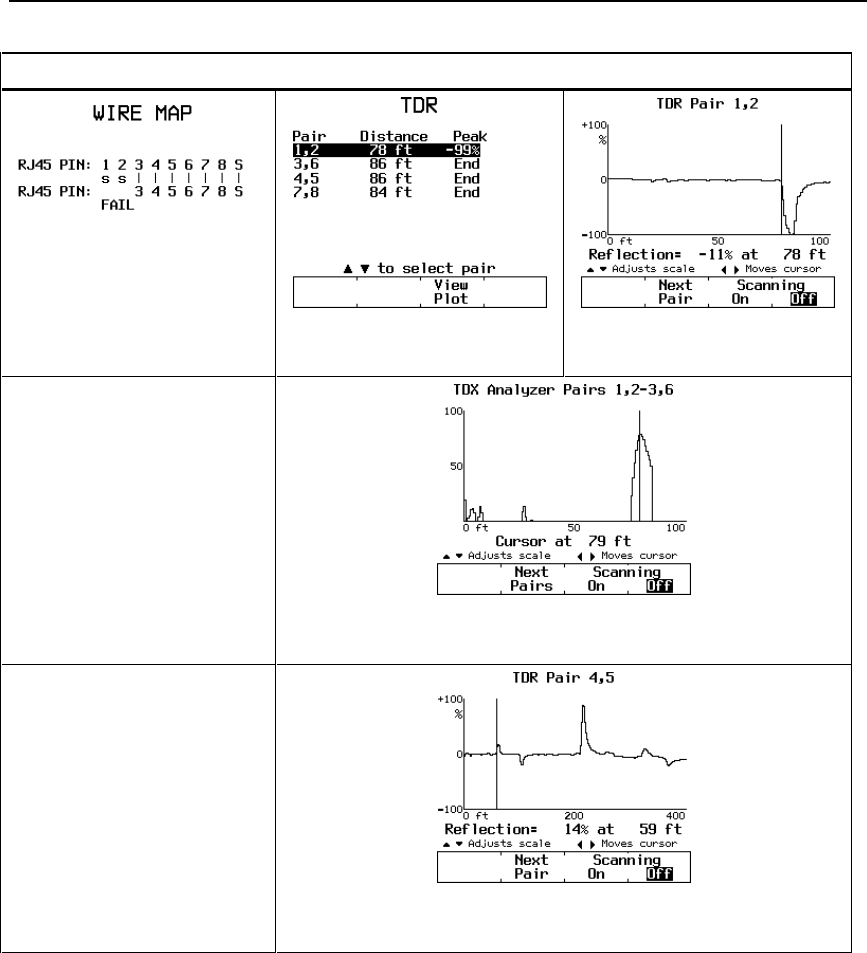
Impedance anomaly is
detected.
gc67i.eps
TDR plot showing impedance anomaly caused by a 150Ω cable
segment in a 100Ω run.