


Reading the Operator Panel Display
The operator panel display is located in the media drawer of the pSeries 690 and is
used to:
v Track the progress of the system unit self tests and configuration program
v Display codes when the operating system comes to an abnormal end
v Display system messages
Checkpoints
During power-on self-test (POST), four-digit checkpoints display, indicating the progress
of the testing. If an error is detected that requires attention, the server halts with an
eight-digit error code displayed in the upper row of the operator panel display, starting
in the leftmost position. This eight-digit error code identifies the error. For a listing of the
error codes, see the Eserver
pSeries 690 Service Guide
.
The four-digit checkpoints are in the form of nnnn, where n is an alphabetic or numeric
character.
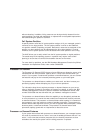
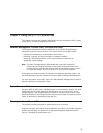
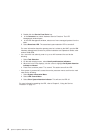
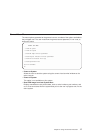
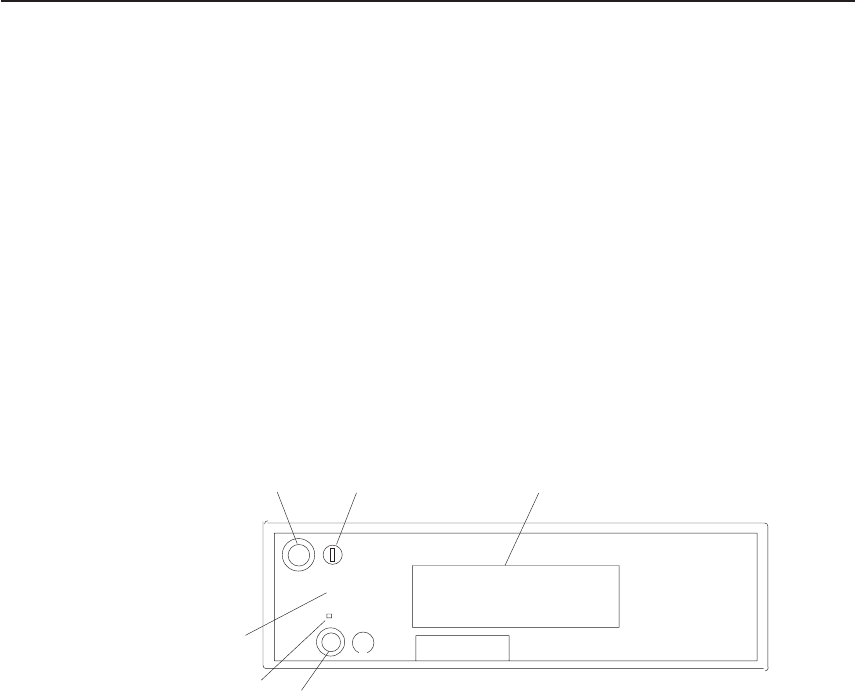
The following diagram shows the locations of the operator panel display and
components of the operator panel.
R
1
2
5
3
4
6
!
1 Power on/off button 4 Reset button
2 Power on/off LED 5 Service processor reset button (Service
use only)
3 Operator panel display 6 Disturbance or system attention LED
Disturbance or System Attention LED
The system attention LED on the operator panel is turned on when an entry is made in
the service processor error log that gets transmitted to the system-level error logs (the
AIX error log and the service action event log in service focal point). When the attention
light comes on, examine these error logs to see if user intervention is required.
If a hardware problem is indicated, call service support. If no intervention is required,
the system attention LED can be turned off by either of the following methods:
v On the HMC’s graphical interface, as follows:
1. Click on the Service Applications icon.
Chapter 2. Using the Eserver pSeries 690 11