25
Configuring and Managing the Switch
CHAPTER 2
Monitoring traffic
Use monitoring commands to determine the traffic volume from
specific ports or between ports. This information helps you determine
the network’s traffic patterns so you can adjust your network topology
for maximum efficiency.
Make sure you get a good statistical representation of your network.
Take a reading when users log on in the morning and pull files from
servers and another during breaks or when users log off at night—any
time you think the network is experiencing heavy traffic. This gives
you a baseline for comparison when problems arise on the network.
Statistics are generated for the current session. Reset counters by
using the
clr-cnt command, warm-reset command, or by cycling the
power.
In general, keep devices that talk primarily to each other on the same
segment (remember, each port is an Ethernet segment). For example,
if a high volume of traffic is forwarded from the CD server on port 4
to the payroll workgroup on port 3, but no other workgroups access
the CD server, move the server to the hub on port 3 instead of the
switch. This change may not be efficient, however, if users from the
payroll, marketing, or finance workgroups also access the CD server.
Under heavy traffic loading conditions, the Console Manager may
understate the Ethernet statistical counts. You can also use a protocol
analyzer to monitor the segment the port is attached to. See step 8 on
page 72 for configuration details.
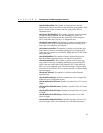
Commands used
get-br-cnt <port>
Displays the packet statistics for a port.
get-eth-cnt <port>
Displays the Ethernet statistics for a port.
get-colls-cnt <port>
Displays the collision distribution counters
for a port.
get-rmon-cnt <port>
Displays the Ethernet RMON counters for a
port.
get-sdist-cnt <port>
Displays the packet size distribution counters
for a port.
get-mgm-brcnt
Displays the statistics for the SNMP agent.
clr-cnt
Resets the Ethernet and bridging statistics.


