


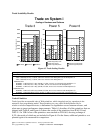


details on the number of I/O fields for each of these workloads. We ran the workloads on three separate
machines (see table 6.5) to validate the performance characteristics with regard to CPW. In our running
of the workloads, we tolerated only a 1.5 second server response time per panel. This value does not
include the time it takes to render the image on the client system, but only the time it took the server to
get the information to the client system. The machines that we used are in Table 6.5, and include the 800
and i810 (V5R2 Hardware) and the 170 (V4R4 Hardware). All systems were running OS/400 V5R2.
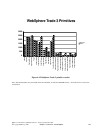
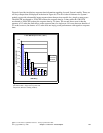
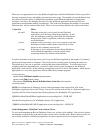
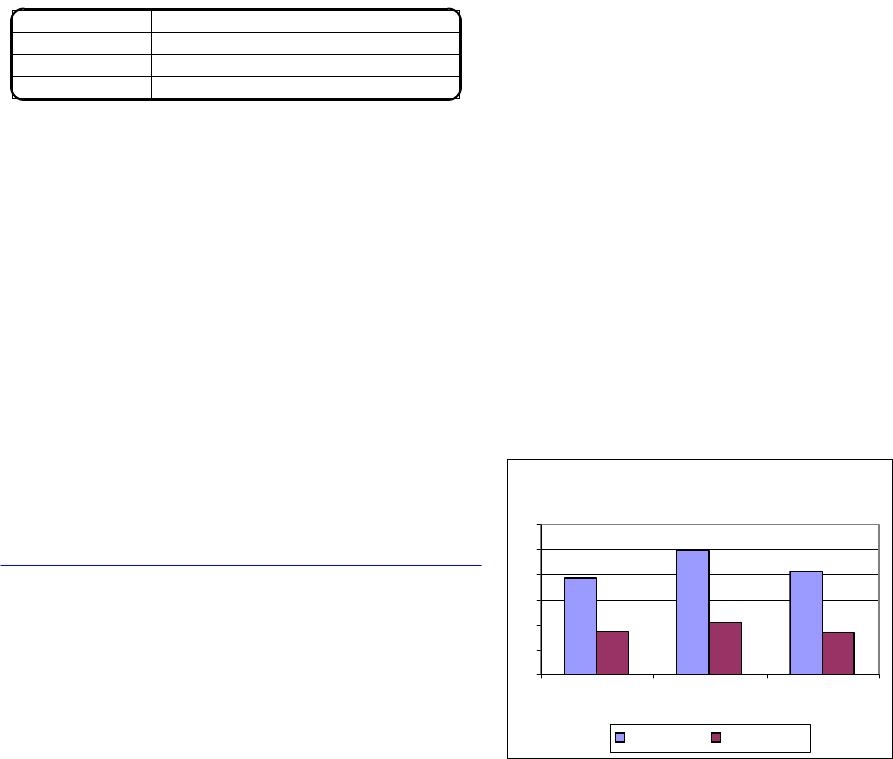
Some of the results that we saw in our tests are shown in Figure 6.8. This figure shows the scalability
across different hardware running the same workload. A user is defined as a client that requests one new
5250 panel every 15 seconds. According to our tests, we see relatively even results across the three
machines. The one machine that is a slight difference is the V4R4 hardware (1090 CPW). This slight
difference can be explained by release-to-release degradation. Since the CPW measurement were made in
V4R4, there have been three major releases, each bringing a slight degradation in performance. This
results in a slight difference in CPW value. With
this taken into effect, the CPW/User measurement is
more in line with the other two machines.
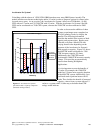
Many 5250 applications have been implemented
with "best performance" techniques, such as
minimized number of fields and amount of data
exchanged between the device and the application.
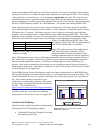
Other 5250 applications may not be as efficiently implemented, such as restoring a complete window of
data, when it was not required. Therefore it is difficult to give a generalized performance comparison
between the same application written to a 5250 device and that application using WebFacing to a
browser. In the three workloads that we measured, we saw a significant amount of resource needed to
WebFace these applications. The numbers varied from 3x up to 8x the amount of CPU resources needed
for the 5250 green screen application.
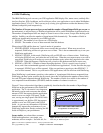
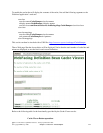
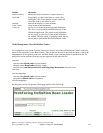
Use the IBM Systems Workload Estimator to predict the capacity characteristics for IBM WebFacing
This site will be updated, more often then this paper, so it will contain the most recent information. The
Workload Estimator will ask you to specify a transaction rate (5250 panels per hour) for a peak time of
day. It will further attempt to characterize your
workload by considering the complexity of the panels
and the number of unique panels that are displayed by
the JSP. You’ll find the tool at:
http://www.ibm.com/eserver/iseries/support/
estimator.
A workload description along with good help text is
available on this site. Work with your marketing
representative to utilize this tool (also see chapter 23).
Version 5.0 of Webfacing
There have been a significant number of enhancements
delivered with V5.0 of Webfacing including:
• (Advanced Edition Only) Support for viewing
and printing spooled files
IBM i 6.1 Performance Capabilities Reference - January/April/October 2008
© Copyright IBM Corp. 2008 Chapter 6 - Web Server and WebSphere 108
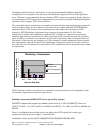
Table 6.4 Average number of I/O fields for each workload
defined in this section.
612Workload C
99Workload B
37Workload A
Average number of I/O Fields / panelName
Figure 6.8 CPW per User across the machines
documented in table 6.5
CPW / User
0
1
2
3
4
5
6
2700 CPW 1090 CPW 300 CPW
WorkLoad C WorkLoad B