


***********************************************************************************
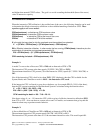
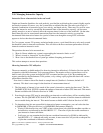
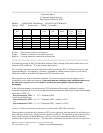
Component Report
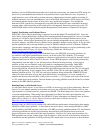
Component Interval Activity
Data collected 190396 at 1030
Member . . . : Q960791030 Model/Serial . : 310-2043/10-0751D Main St...
Library. . : PFR System name. . : TEST01 Version/Re..
32.665.545.546.899.92.45,99111:56
19.956.525.774.299.91.85,06811:51
:
40.764.277.416.597.90.84,52710:56
4986.657.435.697.91.25,62210:51
33.296.65138.897.60.75,46610:46
33.9103.339.545.291.30.97,40410:41
39102.946.332.285.20.86,16410:36
Disk I/O
per sec
Async
Disk I/O
per sec
Sync
CPU %
Batch
CPU%
Inter
CPU %
Total
Rsp/TnsTns/hrITV
End
Itv End------Interval end time (hour and minute)
Tns/hr-------Number of interactive transactions per hour
Rsp/Tns-----Average interactive transaction response time
***********************************************************************************
(Calculate the average of the CPU utilization under the "Inter" heading for the desired time interval for
interactive CPU utilization - "P" in the formula shown below.)
It is possible to have interactive jobs that do not show up with type "INT" in Collection Services or the
Component Report. An example is a job that is submitted as a batch job that acquires a work station.
These jobs should be included in the interactive CPU utilization count.
Most systems have peak workload environments. Care must be taken to ensure that peaks can be
contained in server model environments. Some environments could have peak workloads that exceed
the interactive capacity of a server model or could cause unacceptable response times and
throughput.
In the following equations, let the interactive CPU utilization of the existing traditional system be
represented by percent P. A server model that should then produce the same response time and throughput
would have a CPW of:
Server Interactive CPW = 3 * P * Traditional CPW
or for Custom Models use:
Server Interactive CPW = 1.0 * P * Traditional CPW (when P < 85%)
or
Server interactive CPW = 1.5 * P * Traditional CPW (when P >= 85%)
Use the 1.5 factor to ensure the custom server is sized less than 85% CPU utilization.
These equations provide the server interactive CPU cycles required to keep the interactive utilization at or
below the knee of the curve, with the current interactive workload. The equations given at the end of the
Server and Custom Server Model Behavior section can be used to determine the effective interactive
utilization above the knee of the curve. The interactive workload below the knee of the curve represents
IBM i 6.1 Performance Capabilities Reference - January/April/October 2008
© Copyright IBM Corp. 2008 Chapter 2 - Server Performance Behavior 33