


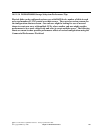
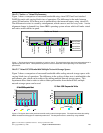
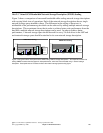
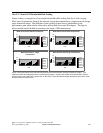
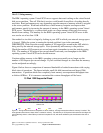
14.6.2.4 Virtual SCSI Bandwidth-Disk Scaling
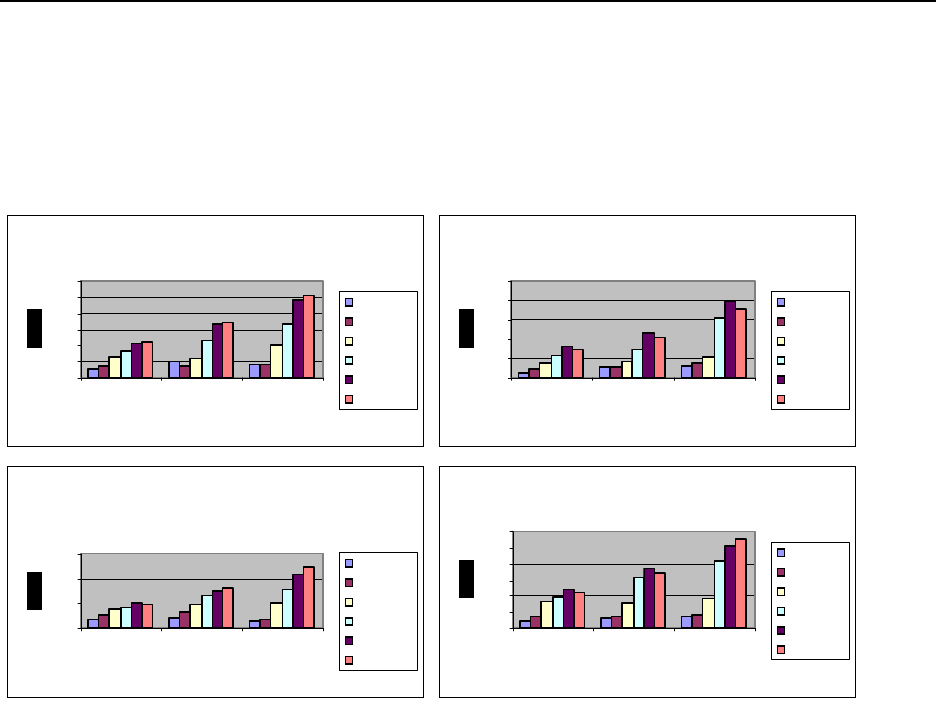
Figure 4 shows a comparison of measured bandwidth while scaling disk drives with varying
block sizes of operations. Each of the network storage descriptions have a single network storage
space attached to them. The difference in the scaling of these tests is attributable to the
performance gain which can be achieved by adding disk drives and IO adapters. The figures
below include small (4k-64k) transactions and larger (128k) transactions.
Read Performance-Small Transactions
0
50
100
15 0
200
250
300
15 Disk 30 Disk 45 Disk
Disk
1 N WSD
2 NWSD
4 NWSD
8 NWSD
16 N W SD
24 NWSD
Write Performance-Small Transactions
0
50
100
15 0
200
250
15 Disk 30 Disk 45 Disk
Disk
1 N WSD
2 NWSD
4 NWSD
8 NWSD
16 N W SD
24 NWSD
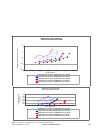
Read Performance - Large
Transactions
0
200
400
600
15 Disk 30 Disk 45 Disk
Disk
1 N WSD
2 NWSD
4 NWSD
8 NWSD
16 N W SD
24 NWSD
Write Performance-Large Transactions
0
50
100
15 0
200
250
300
15 Disk 30 Disk 45 Disk
Disk
1 N WSD
2 NWSD
4 NWSD
8 NWSD
16 N W SD
24 NWSD
Figure 4 The figures above show read and write performance for small (4k-64k) and large transactions (128k+). This
experiment shows that adding disk drives increases the throughput. A system with 45 disk drives will be able to transfer
approximately 3 times faster then a system with 15 disk drives. Notice 24-network storage descriptions were used in order
to achieve maximum performance.
IBM i 6.1 Performance Capabilities Reference - January/April/October 2008
© Copyright IBM Corp. 2008 Chapter 14 DASD Performance 237