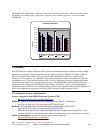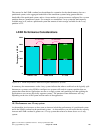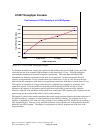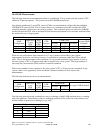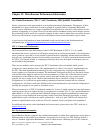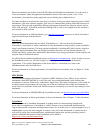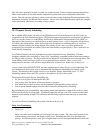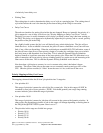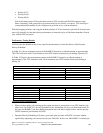
The following chart shows projected LPAR capacities for several LPAR configurations. The projections
are based on measurements on 1 and 2 way measurements when the system’s CPU was utilized at 70
percent capacity. The LPAR overhead was also factored into the projections. The system was at the
V4R4M0 release level.
21 %57002-ways6
26 %59201-ways12
ProcessorsNumber
Projected CPW Increase
Over a Standalone 12-way
Projected LPAR CPW
LPAR Configuration
Table 18.4 Projected LPAR Capacities
18.5 Summary
On a partitioned system the capacity increases will range from 5% to 26%. The capacity increase will
depend on the number of processors partitioned and on the number of partitions. In general the greater
the number of partitions the greater the capacity increase.
When consolidating systems, a reasonable and safe guideline is that a partition may have about 10% less
capacity than an equivalent stand-alone system if all partitions will be running their peak loads
concurrently. This cross-partition contention is significant enough that the system operator of a
partitioned system should consider staggering peak workloads (such as batch windows) as much as
possible.
IBM i 6.1 Performance Capabilities Reference - January/April/October 2008
© Copyright IBM Corp. 2008 Chapter 18 - LPAR 300


