


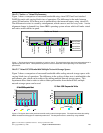
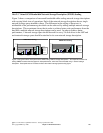
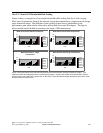
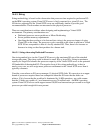
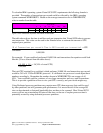
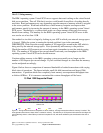
14.6.2.3 Virtual SCSI Bandwidth-Network Storage Description (NWSD) Scaling
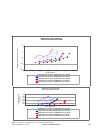
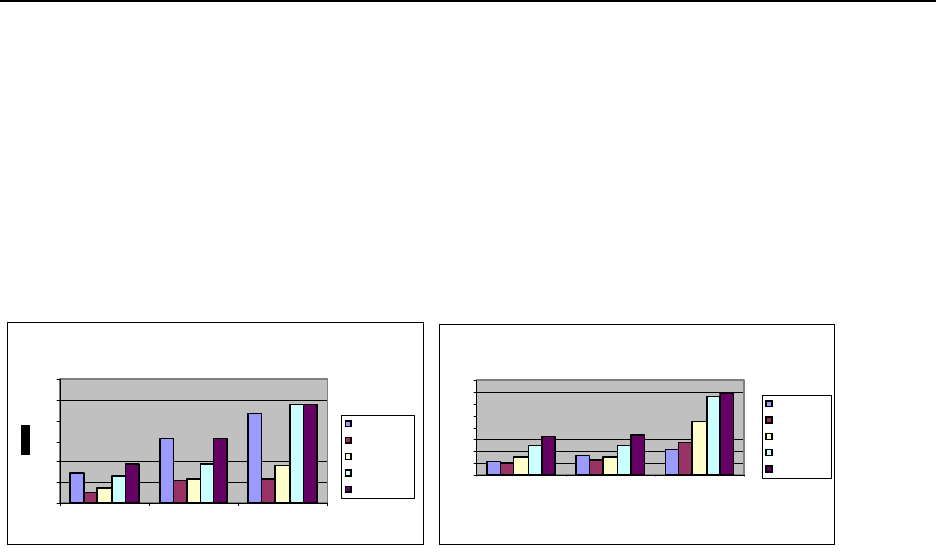
Figure 3 shows a comparison of measured bandwidth while scaling network storage descriptions
with varying block sizes of operations. Each of the network storage descriptions have a single
network storage space attached to them. The difference in the scaling of these tests is
attributable to the performance gain which can be achieved by adding multiple network storage
descriptions. This experiment shows that in order to achieve better write performance from the
hard disk, multiple network storage descriptions can be used. In order to achieve better
performance, 1 network storage space should be used for every 2-4 disk drives in the ASP and
each network storage space should be attached to its own network storage description.
NWSD Read Scaling
0
20
40
60
80
100
120
Small Tr ansact ions
(4k-16k)
Medium Tr ansacti ons
(32k-64k)
Lar ge Tr ansacti ons
(128k+)
AIX Native
1 NWSD Wr i te
2 NWSD Wr i te
4 NWSD Wr i te
8 NWSD Read
NWSD Write Scaling
0
25
50
75
100
125
150
175
200
S m all T ra ns ac tio n s
(4k-16k)
M edium Tr an sact ion s
(32k-64k)
Lar ge Tr ansact ions
(128k+)
AIX Native
1 NWSD Read
2 NWSD Read
4 NWSD Read
8 NWSD Read
Figure 3 The figures above show performance while scaling network storage descriptions. This experiment shows that
adding NWSD increases the throughput for write performance, which was not achievable using 1 network storage
description. Read performance increases similar to the network storage space scaling figure.
IBM i 6.1 Performance Capabilities Reference - January/April/October 2008
© Copyright IBM Corp. 2008 Chapter 14 DASD Performance 236