


89
89
C H A P T E R 5 Managing the Switch
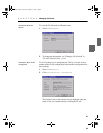
3 Click View and change the presentation style: 3D- to 2D-
Graph, with or without a peak value indicator and vertical to
horizontal bars.
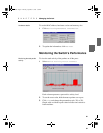
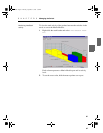
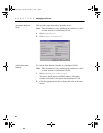
Monitoring the total
activity of transmitted
packets
To view the total activity of the packets being transmitted on all the
switches:
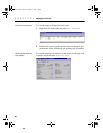
1 Right-click the stack border and select Stack Activ-
ity>Tx Packets
.
Each column represents the activity level on a switch.
2 Hold the cursor on a column to see the exact value.
3 Click View and change the presentation style: 3D- to 2D-
Graph, with or without a peak value indicator and vertical to
horizontal bars.
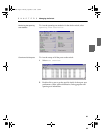
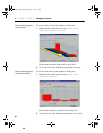
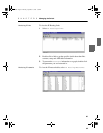
Monitoring the total
activity of received
packets
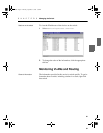
To view the total activity of the packets being received on all the
switches:
1 Right-click the stack border and select Stack Activ-
ity>Rx Packets
.
Each column represents the activity level on that switch.
2 Hold the cursor on a column to see the exact value.
3 Click View and change the presentation style: 3D- to 2D-
Graph, with or without a peak value indicator and vertical to
horizontal bars.
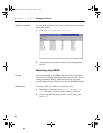
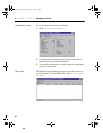
Monitoring the total
number of errors
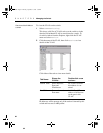
To view the total error activity of the packets on all the switches:
1 Right-click the stack border and select Stack Activ-
ity>Errors
.
Each column represents the activity level on that switch.
2 Hold the cursor on a column to see the exact value.
3 Click View and change the presentation style: 3D- to 2D-
Graph, with or without a peak value indicator and vertical to
horizontal bars.
500.book Page 89 Thursday, September 2, 1999 1:50 PM