


Monitoring Tools 12-111
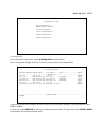
Each LED representation can report one of four states:
–: A dash means the LED is off.
R: The letter “R” means the LED is red.
G: The letter “G” means the LED is green.
Y: The letter “Y” means the LED is yellow.
The section “Netopia R910 Ethernet Router status lights” on page 3-16 describes the meanings of the colors
for each LED.
Note: Although the Quick VIew LED Status section lists the Channel 2 (CH2) LED, it is not used on the R910.
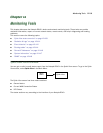
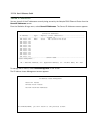
Statistics & Logs
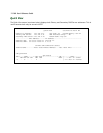
When you are troubleshooting your Netopia R910, the Statistics & Logs screens provide insight into the recent
event activities of the router.
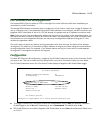
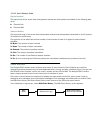
From the Main Menu go to Statistics & Logs and select one of the options described in the sections below.
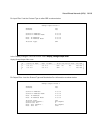
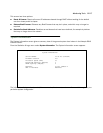
General Statistics
To go to the General Statistics screen, select General Statistics and press Return. The General Statistics
screen appears.
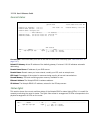
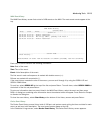
The General Statistics screen displays information about data traffic on the Netopia R910’s data ports. This
information is useful for monitoring and troubleshooting your LAN. Note that the counters roll over at their
maximum field width, that is, they restart again at 0.
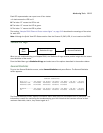
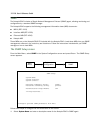
• General StatisticsStatistics & Logs
Main
Menu
General Statistics
Phys I/F---------Rx Bytes---Tx Bytes---Rx Pkts---Tx Pkts----Rx Err----Tx Err
Ethernet Hub 123456789 123456789 12345678 12345678 12345678 12345678
Ethernet Wan1 123456789 123456789 12345678 12345678
Network----------Rx Bytes---Tx Bytes---Rx Pkts---Tx Pkts----Rx Err----Tx Err
IP 123456789 123456789 12345678 12345678 12345678 12345678