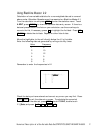
In our example, the smallest value is 13 and the largest value is 41. The logical
intervals for the data set would be 10-19 (tens), 20-29 (twenties), 30-39 (thirties),
and 40-49 (forties). Notice, each data point is included within an interval
(exhaustive intervals) and only within one interval (exclusive intervals).
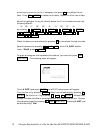
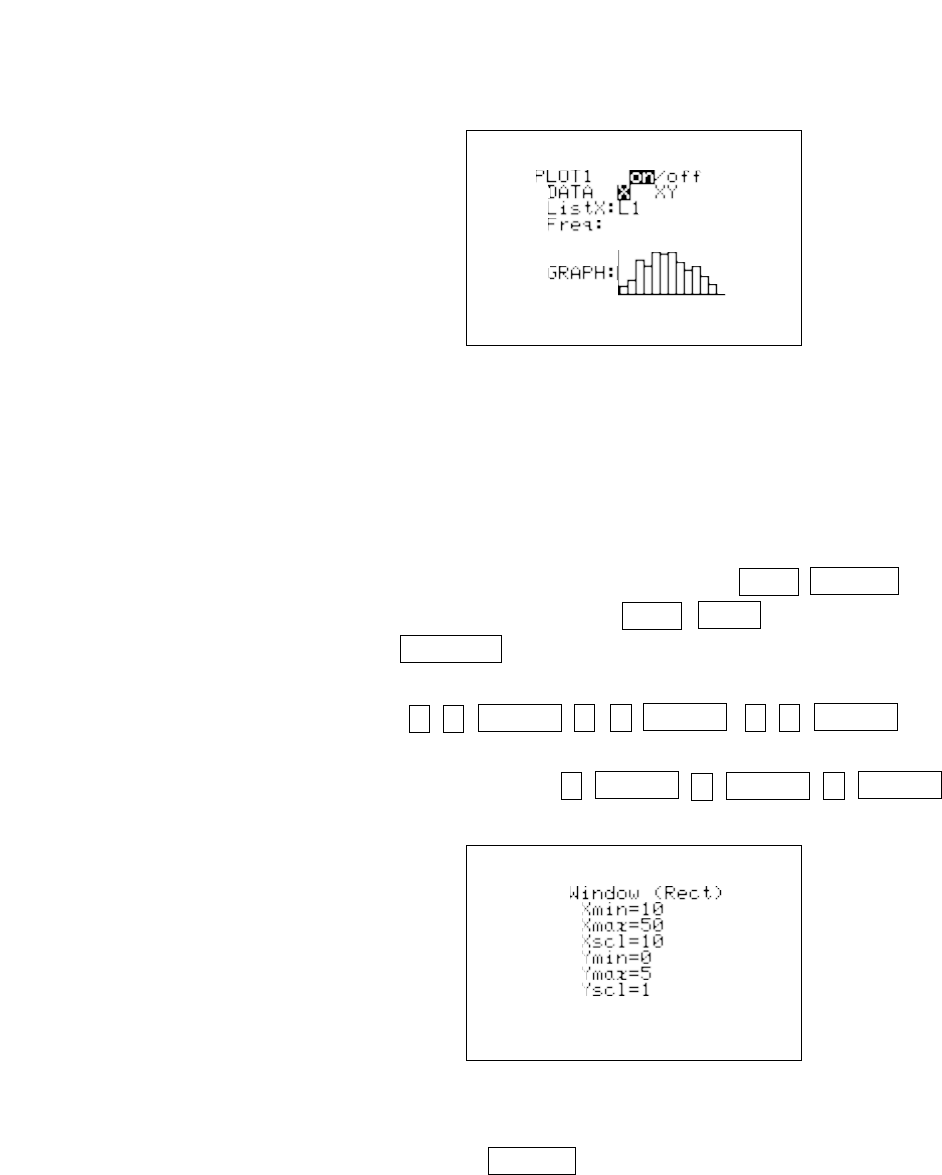
Set the calculator to rectangular graphing by pressing 2ndF SET UP , touch
E COORD, double touch 1 Rect, and press 2ndF QUIT . Set the viewing
window by pressing WINDOW . Set the horizontal axis to 10 < x < 50 (beginning
and ending values for intervals described previously) with Xscl = 10 (width of
interval) by pressing 1 0 ENTER 5 0 ENTER 1 0 ENTER . Set the
vertical axis to 0 < y < 5 (from no data points to at most five within the interval)
with Yscl = 1 (counting) by pressing 0 ENTER 5 ENTER 1 ENTER .
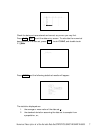
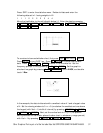
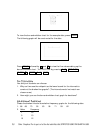
To view the histogram, press GRAPH . The following histogram will be
constructed for the data.
Histogram Representation of a One-Variable Data Set/STATISTICS USING THE SHARP EL-9600 13


