


To overlay the regression line and the scatter diagram for the data, you must
first set up the scatter diagram by pressing 2ndF STAT PLOT , touching
A PLOT1, pressing ENTER ENTER ▼ ENTER ▼ 2ndF L1 ENTER
2ndF L2 ENTER 2ndF STAT PLOT , touching G S.D., and touching 3 Scattr.
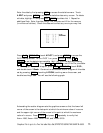
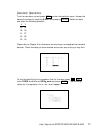
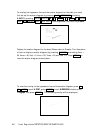
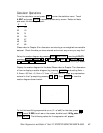
Display the scatter diagram for the data (Please refer to Chapter 7 for discussion
of how to display a scatter diagram) by pressing WINDOW and setting Xmin =
20, Xmax = 45, Xscl = 5, Ymin = 25, Ymax = 40, and Yscl = 5. Press GRAPH to
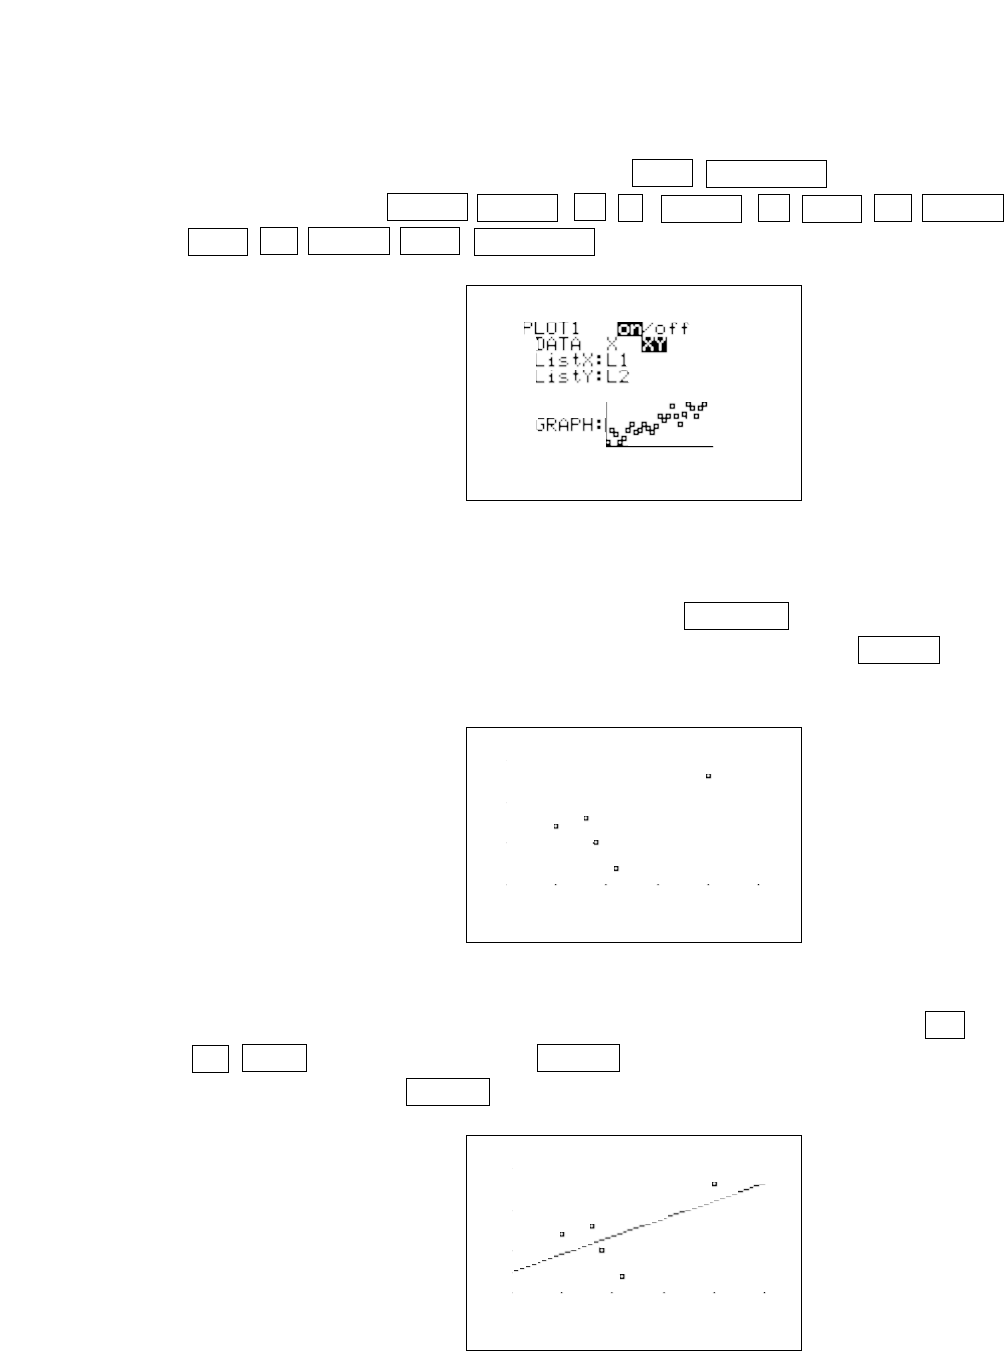
view the scatter diagram shown below:
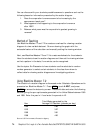
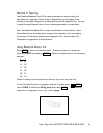
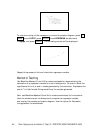
To view the overlay of the regression line and the scatter diagram, press Y=
CL VARS , touch H STAT, press ENTER , touch B REGEQN, double touch
1 RegEqn, and press GRAPH . The following overlay will be displayed.
40 Linear Regressions/STATISTICS USING THE SHARP EL-9600
▼