


Blackline Masters/STATISTICS USING THE SHARP EL-9600 83
Copyright © 1998, Sharp Electronics Corporation. Permission is granted to photocopy for educational use only.
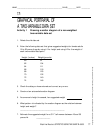
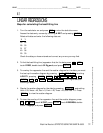
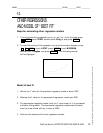
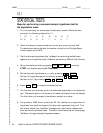
Steps for calculating other regression models
1. To find the best-fitting quadratic curve (y = ax
2
+ bx + c) for the data, press
STAT , touch D REG, double touch 04 Rg_x
2
, and press ENTER .
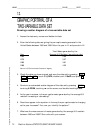
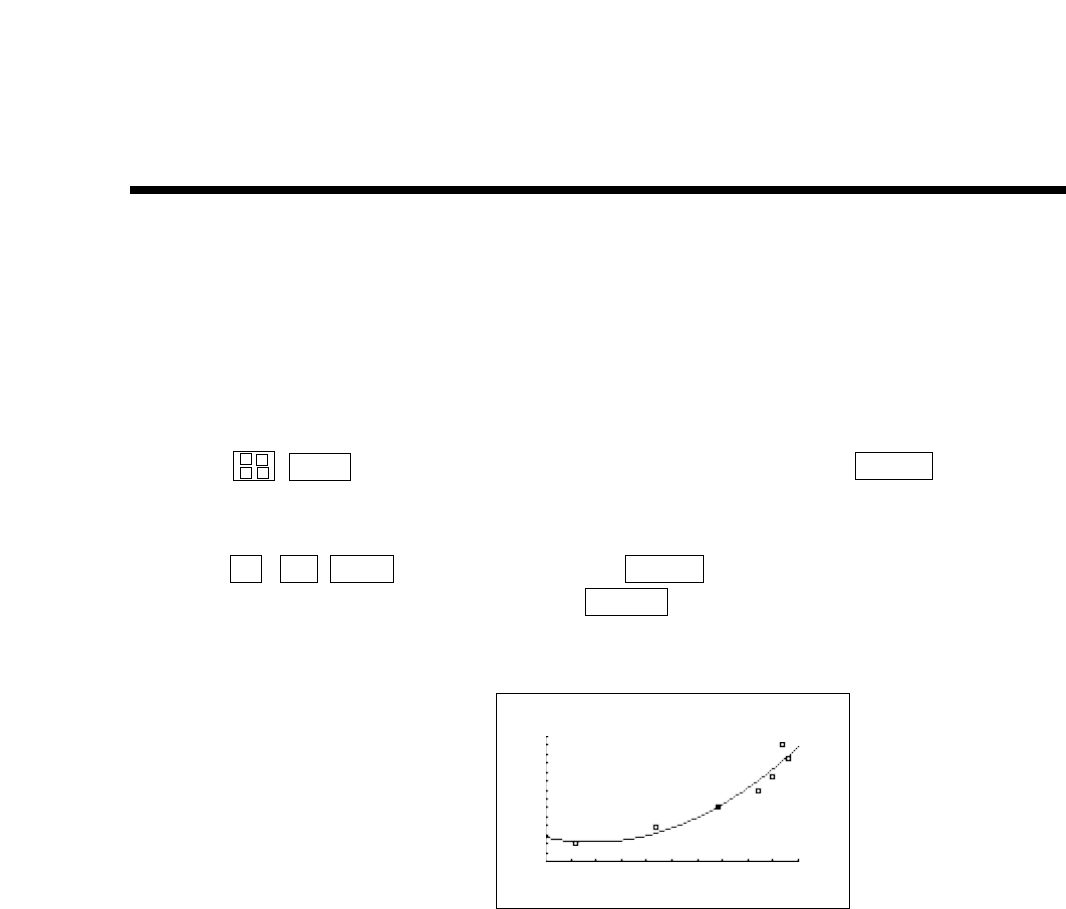
2. To view the overlay of the regression curve and the scatter diagram, press
Y= CL VARS , touch H STAT, press ENTER , touch B REGEQN,
double touch 1 RegEqn, and press GRAPH . The following overlay
will be displayed.
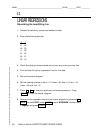
Model of best fit
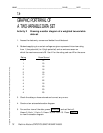
1. Notice, the r
2
value for the quadratic regression model is about .9337.
2. Whereas ther
2
value for the exponential regression model was .9786.
3. The exponential regression model (with the r
2
value closer to 1) is considered
the better-fitting model. The exponential regression model even fits better
than the linear model with an r
2
value of .8553.
4. Continue this analysis with other regression models.
OTHER REGRESSIONS
AND MODEL OF “BEST FIT”
9.2
NAME _____________________________________________________ CLASS __________ DATE __________
×
+
–
÷