


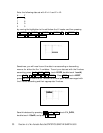
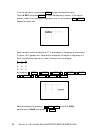
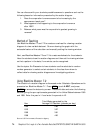
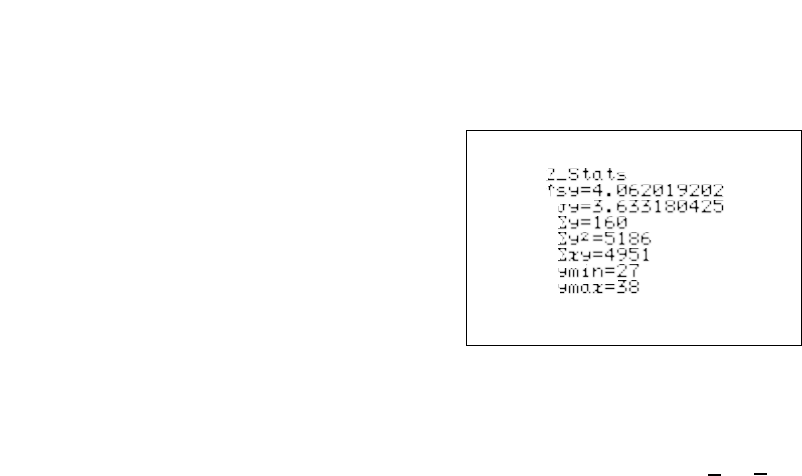
The statistics displayed are:
1. the average or mean value of the variable, or ;
2. the standard deviation assuming the data points are a sample
from a population, sx or sy;
3. the standard deviation assuming the data points represents the
entire population, σx or σy;
4. the sum of the values, ∑x or ∑y;
5. the sum of the squared values, ∑x
2
or ∑y
2
;
6. the number of data points, n;
7. the minimum variable value, xmin or ymin;
8. the maximum variable value, xmax or ymax; and
9. the sum of the x and y products, ∑xy.
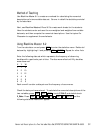
Your students may have trouble with conceptualizing the meaning of standard
deviation. Tell them it is a measure of variability (dispersion) that is related to
the average deviation or average distance from a data value to the mean.
28 Numerical Description of a Two-Variable Data Set/STATISTICS USING THE SHARP EL-9600
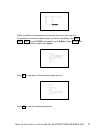
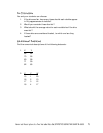
x
y