


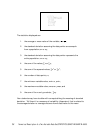
Check the data you have entered, and save the data set by pressing 2ndF
QUIT 2ndF LIST , touch C L_DATA, double touch 1 StoLD, and press 1
ENTER .
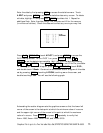
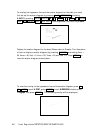
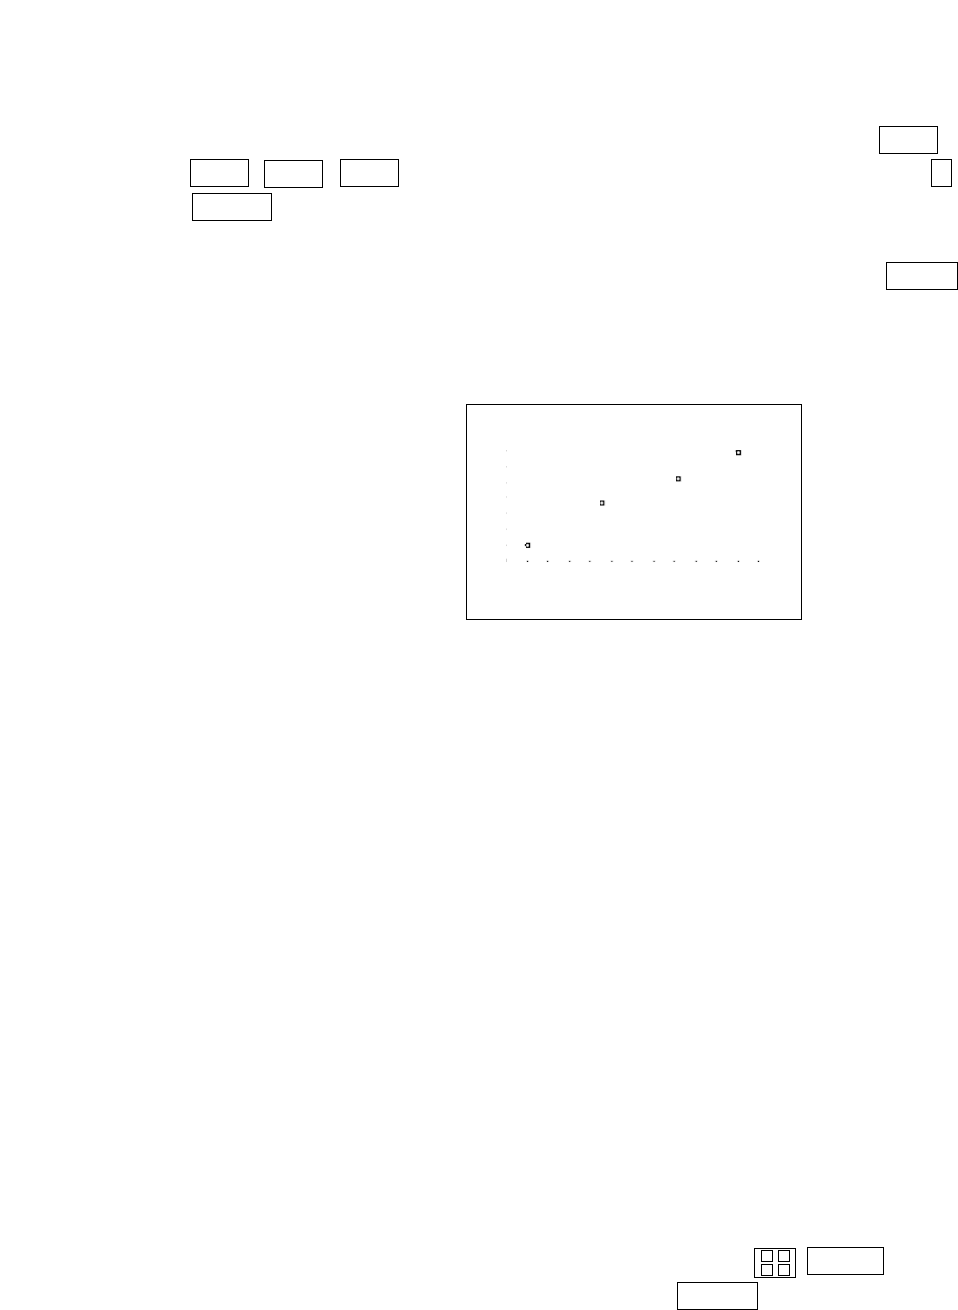
Construct an autoscaled scatter diagram of this data set by pressing ZOOM ,
touching A ZOOM, touching on the screen, and double touching 9 Stat.
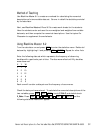
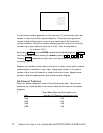
You will see the following graph:
You can use questions such as the following to discuss the information
presented by the scatter diagram.
1. As the year increases, is the per capita waste generated by the
average U.S. resident increasing or decreasing?
2. Does there appear to be a pattern in the way the per capita
waste is changing as the year increases? If so, can you identify
the pattern?
3. What was the mean amount of waste generated by the average
U.S. resident between 1960 and 1988? Give units with your
answer.
For Discussion
Your students will find it interesting to generate their own data to be graphed
in the form of a scatter diagram. You can use the calculator’s random number
generator to select a random sample of students for collection of data.
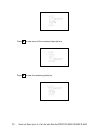
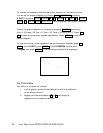
The random number generator is accessed by pressing MATH , touching
C PROB, and double touching 1 random. Press ENTER several times to
observe some of the random values.
Graphical Portrayal of a Two-Variable Data Set/STATISTICS USING THE SHARP EL-9600 35
➧
×
+
–
÷