


Blackline Masters/STATISTICS USING THE SHARP EL-9600 77
Copyright © 1998, Sharp Electronics Corporation. Permission is granted to photocopy for educational use only.
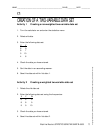
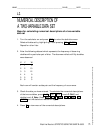
Activity 1 Drawing a scatter diagram of a non-weighted
two-variable data set
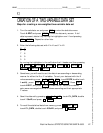
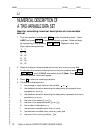
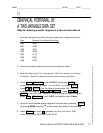
1. Delete the old data set.
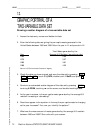
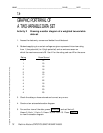
2. Enter the following data set that gives suggested weights for female adults
18 to 35 years of age by using L1 for height and using L2 for the weight of
each two-variable data point:
Height (inches) W
eight(pounds)
60 97
62 104
64 111
66 118
68 125
70 132
72 140
74 148
3. Check the data you have entered and correct any errors.
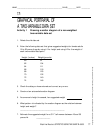
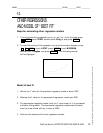
4. Construct an autoscaled scatter diagram.
5. As a woman’s height increased, her suggested weight
.
6. What pattern is indicated by the scatter diagram as the relation between
height and weight?
________________________________________________
7. Estimate the suggested weight for a 5'11" tall woman between 18 and 35
years old. _______________
GRAPHICAL PORTRAYAL OF
A TWO-VARIABLE DATA SET
7.3
NAME _____________________________________________________ CLASS __________ DATE __________