


You can discuss with your students possible answers to questions such as the
following based on information presented by the scatter diagram:
1. Does the corporation’s revenue seem to be increasing by the
same amount each year?
2. What appears to be happening to the corporation’s revenue
after 1995?
3. Between what years was the corporation’s greatest growing in
revenue?
Method of Teaching
Use Blackline Masters 7.1 and 7.2 to create an overhead for drawing a scatter
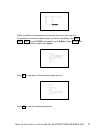
diagram of a two-variable data set. Go over drawing the graph with the
autoscale feature of the calculator and manually setting the viewing window.
Next, use Blackline Masters 7.3 and 7.4 to create worksheets for the students.
Have the students draw the scatter diagrams and then set the viewing window
so that a pattern in the data, if one exists, can be recognized.
Use the topics For Discussion to have students use the calculator’s random
number generator to select certain students in the class from whom to
collect data for drawing scatter diagrams and investigating patterns.
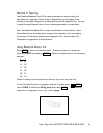
Using Blackline Master 7.2
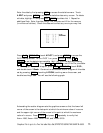
The creation of a scatter diagram is discussed under Calculator Operations and is
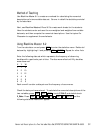
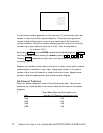
presented on Blackline Master 7.1. Press STAT , touch A EDIT, and press
ENTER to access the data entry screen. Delete old data and enter the following
data set giving the per capita waste generated in the United States between 1960
and 1988. Enter the year in L1 and enter the pounds in L2.
Total Waste generated by the
Y
ear Average U.S. Resident (pounds per day)
1960 2.66
1970 3.27
1980 3.61
1988 4.00
Source: U.S. Environmental Protection Agency
34 Graphical Portrayal of a Two-Variable Data Set/STATISTICS USING THE SHARP EL-9600