


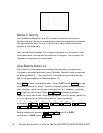
Method of Teaching
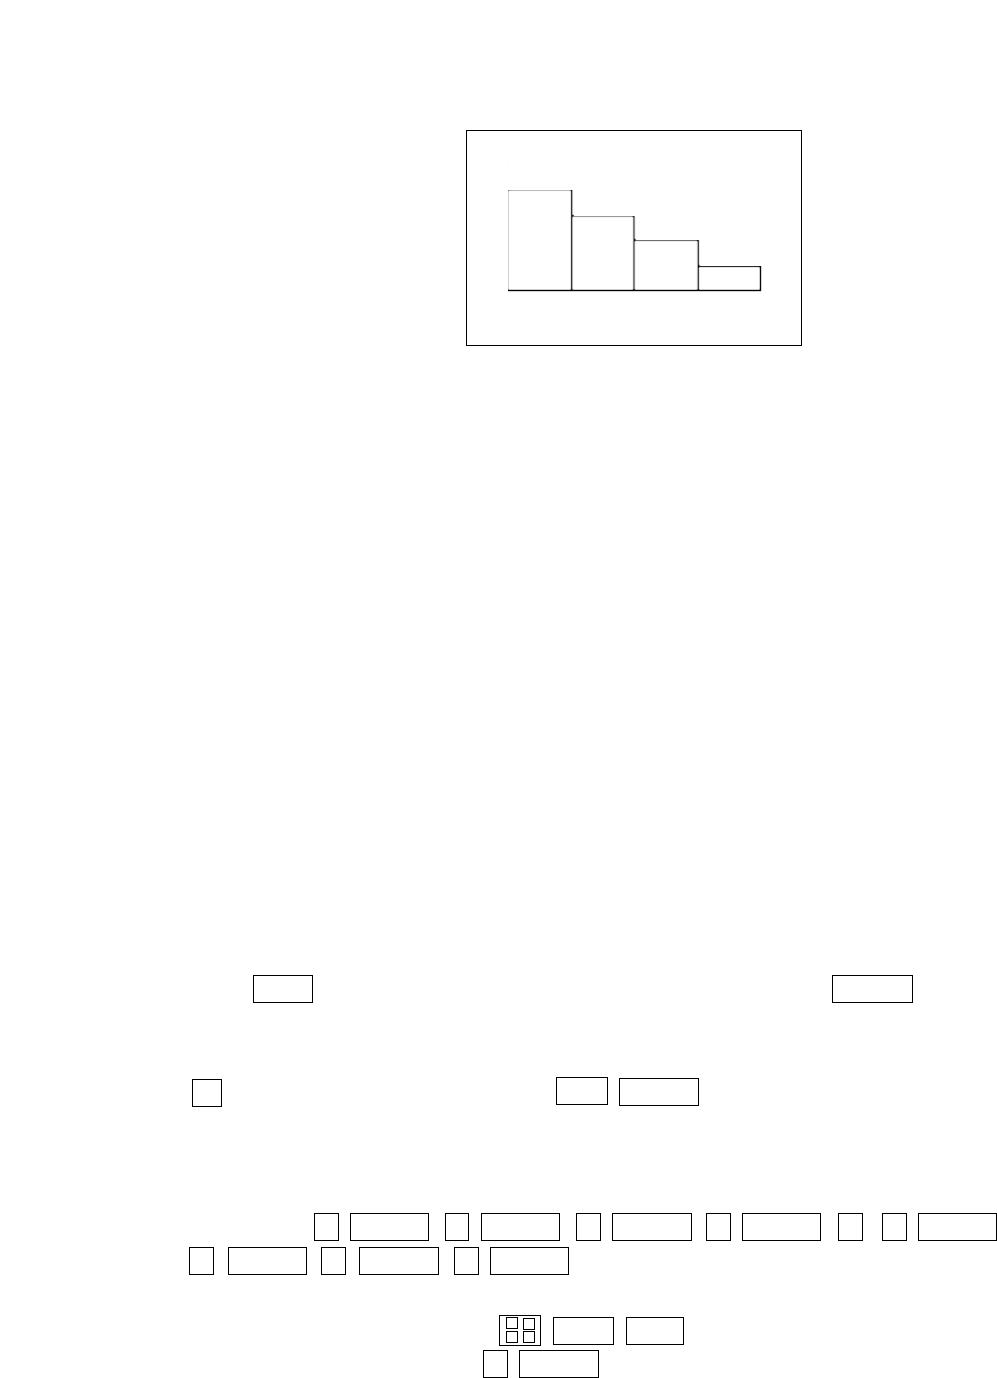
Use the Blackline Masters 3.1 and 3.2 to create overheads for entering one
variable data sets that are non-weighted and weighted and graphing a histogram
that represents the data. Go over in detail how to select interval size either
logically or mathematically.
Next, use the Blackline Master 3.3 to create a worksheet for the students. Have
the students enter the data sets and construct a histogram. Use the topics For
Discussion to supplement the worksheets.
Using Blackline Master 3.2
The creation of a non-weighted one-variable data set and its corresponding
histogram is discussed previously under Calculator Operations and is presented
on Blackline Master 3.1. The construction of a weighted one-variable data set
and its histogram appears on Blackline Master 1.2.
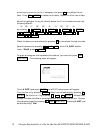
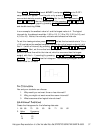
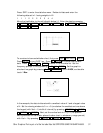
Press STAT to enter the statistics menu. Touch A EDIT, press ENTER , to view
the statistics data entry screen. If there is a data set present within the lists on
your calculator, use the arrow keys to move to the list, if necessary, and press
▲ to highlight the list label. Press DEL ENTER to delete the old data.
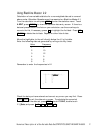
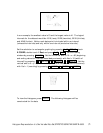
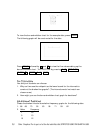
Repeat for other lists of data. Move the highlighter to the cell directly below the
L1 in the table and enter the following data set using the weights:
1112222344
by pressing 1 ENTER 2 ENTER 3 ENTER 4 ENTER 3 ENTER
4 ENTER 1 ENTER 2 ENTER .
Save this data set by pressing 2ndF LIST , touch C L_DATA,
double touch 1 StoLD, press 2 ENTER .
14 Histogram Representation of a One-Variable Data Set/STATISTICS USING THE SHARP EL-9600
▼
×
+
–
÷