


5 – Managing Ports
Graphing Port Performance
59097-01 A 5-23
0
5.6.7
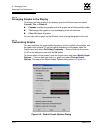
Displaying Graphs for a Switch
To display graphs, do the following:
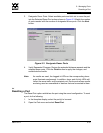
1. Open the Fabric menu and select Add Fabric or click the Add button. Enter
a fabric name and an IP address in the Add a New Fabric dialog. Include an
account name and a password if required.
2. Set the graphing options and polling frequency. By default, SANsurfer
Performance Viewer plots total bytes transmitted and received at a polling
frequency of once per second. Refer to ”Customizing Graphs” on page 5-24
for information about changing what is plotted and how it is plotted.
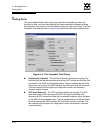
3. You can display graphs in the following ways:
Click on a switch entry handle and select one or more ports.
Right click on a switch icon in the fabric tree and select Open Graph
for All Ports on Switch or Open Graph for All Logged-In Ports on
Switch from the pull-down menu.
4. You can move graphs around individually by clicking and dragging, or you
can arrange them as a group. Refer to ”Arranging Graphs in the Display” on
page 5-24 for more information.
To remove a graph, click the graph Remove button. To remove all graphs, open
the Window menu and select Close All.
To remove a fabric and its graphs, select the fabric in the fabric tree, then select
Remove Fabric from the Fabric menu. You can also right click on a fabric and
select Remove Fabric for the popup menu.
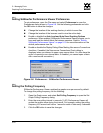
Right clicking on a graph opens a popup menu from which you can change graph
options, print a graph, or save the graph statistics to a file.
5.6.7.1
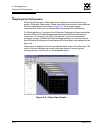
Displaying Graphs for a Stack
The switch management application recognizes switches as a stack if they are
connected by their high speed stacking ports (10-Gbps switches only). The switch
management application will auto-detect such switches connected by their
10-Gbps ports and will display these stacked switches as a single stack entity in
the topology and faceplate displays.
Graphs can be displayed for all ports on all switches in a stack or for only those
ports on all switches that are logged in. To display graphs for stacks, do the
following:
1. In the left-pane/fabric tree, right-click on a Stack icon.
2. In the popup menu, select Open Graph For All Ports on Stack or Open
Graph For All Logged-In Ports on Stack.