


102 8E6 TECHNOLOGIES, ENTERPRISE REPORTER 3.0 USER’S GUIDE
CLIENT USER SECTION: CHAPTER 2 - ACCESSING THE CLIENT
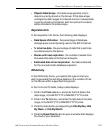
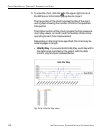
5. To view the chart, click the in the upper right corner of
the ER Server Information popup box to close it.
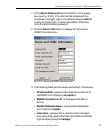
The top portion of the chart includes the title of the chart,
and a graph showing the number of hits for the specified
time period.
The bottom portion of the chart includes the time measure-
ment (day, week, or month) and the Number of Hits corre-
sponding to each time measurement.
Depending on the time frame specified, this chart may be
several pages in length.
• Hits By Day - If you selected Hits By Day, each day within
the date range is plotted on the graph, with the date
(month, day, and year) labeled below.
Fig. 2:2-8 Hits Per Day chart