


8E6 TECHNOLOGIES, ENTERPRISE REPORTER 3.0 USER’S GUIDE 153
CLIENT USER SECTION: CHAPTER 4 - USING THE CLIENT
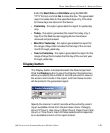
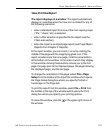
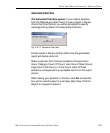
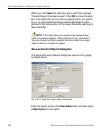
Generate Chart box
The Generate Chart box opens: If you made a selection
from the Reports pull-down menu to view a report in the pie
chart or bar chart format, you will be prompted to specify
viewing/printing criteria in the Generate Chart box.
Entries made in this box further define how the generated
report will display and print.
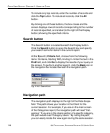
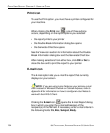
Make a selection from choices available in the pull-down
menu: Category Count, IP Count, User Count, Object Count,
Page Count, Site Count, or Time Count. Each of these
selections corresponds to an available column on the report
screen.
After making your selection in this box, click Go to close the
box and to view the report in a window. (See View, Print the
Report for view/print options.)
Fig. 2:4-13 Generate Chart box