


8E6 TECHNOLOGIES, ENTERPRISE REPORTER 3.0 USER’S GUIDE 65
ADMINISTRATOR SECTION: CHAPTER 2 - CONFIGURING THE ER 3.0 SERVER
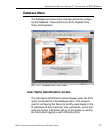
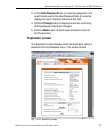
The following options are available on this screen:
• View Diagnostic Reports
• View Database Status Logs
• Change Database (Client) Password
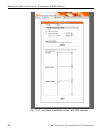
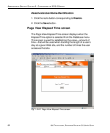
View Diagnostic Reports
1. Choose a report from the pull-down menu (Table Status,
Process List, Full Process List, Tables, or Daily Summary).
2. Click the View button to view the selected diagnostic report
in a popup window:
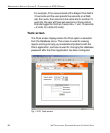
• Table Status - This report contains a list of Client table
names, and columns of statistics on each table, such as
type, size, number of rows, and time created and up-
dated.
• Process List - This report shows a list of current SQL
queries in the database, in an abbreviated format.
• Full Process List - This report shows a list of current
SQL queries in the database, in the full format that
includes all columns of data.
• Tables - This report contains a list of the names of tables
currently in the database.
• Daily Summary - This report shows the date range of
summary tables currently in the database.
3. Click the in the upper right corner of the popup window
to close the window.
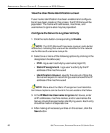
View Database Status Logs
1. Choose a database status log from the pull-down menu (db
Combine, db Split, db Identify, Error Entries, or File Watch
Log).