


ADMINISTRATOR SECTION CHAPTER 2: CONFIGURING THE ER SERVER
8E6 TECHNOLOGIES, ENTERPRISE REPORTER ADMINISTRATOR USER GUIDE 87
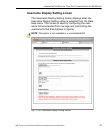
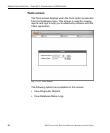
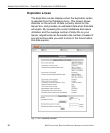
View Diagnostic Reports
1. Choose a report from the pull-down menu (Table Status,
Process List, Full Process List, Tables, or Daily
Summary).
2. Click the View button to view the selected diagnostic
report in a pop-up window:
• Table Status - This report contains a list of Client table
names, and columns of statistics on each table, such
as type, size, number of rows, and time created and
updated.
• Process List - This report shows a list of current SQL
queries in the database, in an abbreviated format.
• Full Process List - This report shows a list of current
SQL queries in the database, in the full format that
includes all columns of data.
• Tables - This report contains a list of the names of
tables currently in the database.
• Daily Summary - This report shows the date range of
summary tables currently in the database.
3. Click the “X” in the upper right corner of the pop-up
window to close the window.
View Database Status Logs
1. Choose a database status log from the pull-down menu.
2. Click the View button to view the selected database
status log in a pop-up window:
• db Active - This log indicates when client tables were
last updated with hits_objects and hits_pages.
• db Backup - This log provides information about the
MySQL backup/restore operation.
• db Control - This log shows a list of actions performed
by the ER process when processing log files.