


54Switched Rack PDU User Guide
Web Interface Features
Read the following to familiarize yourself with basic Web interface features for your Rack PDU.
Tabs
The following tabs are available:
• Home: Appears when you log on. View active alarms, the load status of the Rack PDU, and
the most recent Rack PDU events. For more information, see “About the Home Tab” on
page 58.
• Device Manager: View the load status, configure load thresholds, and view and manage peak
load measurements for all connected devices, phases, and banks as applicable. Manage and
control outlets. For more information, see “About the Device Manager Tab” on page 59.
• Environment: View temperature and humidity sensor data, if a sensor is connected to the Rack
PDU.
• Logs: View event, data, and system logs.
• Administration: Configure security, network connection, notification, and general settings.
Device status icons
One or more icons and accompanying text indicate the current operating status of the Rack PDU:
At the upper right corner of every page, the Web interface displays the same icons currently displayed on
the Home page to report Rack PDU status:
• The No Alarms icon if no alarms exist.
• One or both of the other icons (Critical and Warning) if any alarms exist, and after each icon, the
number of active alarms of that severity.
To return to the Home tab to view its summary of the Rack PDU status, including the active alarms, click
a quick status icon on any page of the interface.
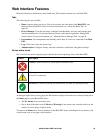
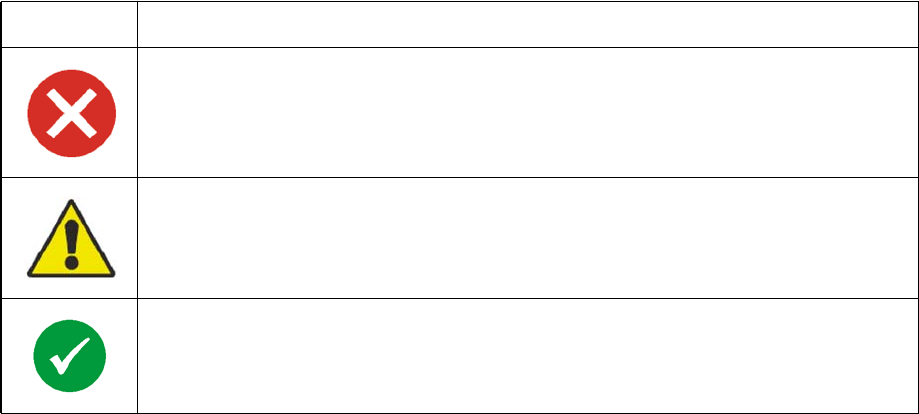
Symbol Description
Critical: A critical alarm exists, which requires immediate action.
Warning: An alarm condition requires attention and could jeopardize your data or equipment if
its cause is not addressed.
No Alarms: No alarms are present, and the Rack PDU and NMC are operating normally.