Switched Rack PDU User Guide73
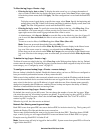
To filter the log (Logs > Events > log):
• Filtering the log by date or time: To display the entire event log, or to change the number of
days or weeks for which the log displays the most recent events, select Last. Select a time range
from the drop-down menu, then click Apply. The filter configuration is saved until the Rack PDU
restarts.
To display events logged during a specific time range, select From. Specify the beginning and
ending times (using the 24-hour clock format) and dates for which to display events, then click
Apply. The filter configuration is saved until the Rack PDU restarts.
• Filtering the log by event: To specify the events that display in the log, click Filter Log. Clear
the checkbox of an event category or alarm severity level to remove it from view. Text at the
upper right corner of the event log page indicates that a filter is active.
As Administrator, click Save As Default to save this filter as the default log view for all users. If
you do not click Save As Default, the filter is active until you clear it or until the Rack PDU
restarts.
To remove an active filter, click Filter Log, then Clear Filter (Show All).
Note: Events are processed through the filter using OR logic.
Events that you do not select from the Filter By Severity list never display in the filtered event
log, even if the event occurs in a category you selected from the Filter by Category list.
Events that you do not select from the Filter by Category list never display in the filtered event
log, even if devices in the category enter an alarm state you selected from the Filter by Severity
list.
To delete the log (Logs > Events > log):
To delete all events recorded in the log, click Clear Log on the Web page that displays the log. Deleted
events cannot be retrieved. To disable the logging of events based on their assigned severity level or their
event category, see “Configure by event” on page 92.
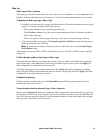
To configure reverse lookup (Logs > Events > reverse lookup):
Reverse lookup is disabled by default. Enable this feature unless you have no DNS server configured or
have poor network performance because of heavy network traffic.
With reverse lookup enabled, when a network-related event occurs, both the IP address and the domain
name for the networked device associated with the event are logged in the event log. If no domain name
entry exists for the device, only its IP address is logged with the event. Since domain names generally
change less frequently than IP addresses, enabling reverse lookup can improve the ability to identify
addresses of networked devices that are causing events.
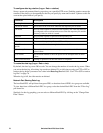
To resize the event log (Logs > Events > size):
By default, the event log stores 400 events. You can change the number of events the log stores. When
you resize the event log, all existing log entries are deleted. To avoid losing log data, use FTP or SCP to
retrieve the log before you enter a new value in the Event Log Size field. See “Use FTP or SCP to
retrieve log files” on page 76.
When the log is full, the older entries are deleted.
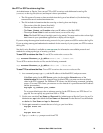
Network Port Sharing event logs and traps.
Rack PDU events from guest PDUs are sent to the host PDU for inclusion into its log. The log entry will
include the Display ID of the unit that the event occurred on.
These events are then handled the same as local events from the host PDU. Therefore alarms, SNMP
traps, e-mails, Syslog, etc will support Rack PDU events and alarms from all Rack PDUs in a group.
Example event log: Rack PDU 4: Outlet #2 off.
Note: System events will only be logged for the host PDU. System events from guest PDUs will not be
logged on the host PDU.


