


Quality of Service
Managing QoS Statistics
521 Cisco Small Business 200, 300 and 500 Series Managed Switch Administration Guide (Internal Version)
25
To view Queues Statistics:
STEP 1 Click Quality of Service > QoS Statistics > Queues Statistics.
This page displays the following fields:
• Refresh Rate—Select the time period that passes before the interface
Ethernet statistics are refreshed. The available options are:
- No Refresh—Statistics are not refreshed.
- 15 Sec—Statistics are refreshed every 15 seconds.
- 30 Sec—Statistics are refreshed every 30 seconds.
- 60 Sec—Statistics are refreshed every 60 seconds.
• Counter Set—The options are:
- Set 1—Displays the statistics for Set 1 that contains all interfaces and
queues with a high DP (Drop Precedence).
- Set 2—Displays the statistics for Set 2 that contains all interfaces and
queues with a low DP.
• Interface—Queue statistics are displayed for this interface.
• Queue—Packets were forwarded or tail dropped from this queue.
• Drop Precedence—Lowest drop precedence has the lowest probability of
being dropped.
• Tot al Packet s—Number of packets forwarded or tail dropped.
• Tail Drop Packets—Percentage of packets that were tail dropped.
STEP 2 Click Add.
STEP 3 Enter the parameters.
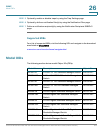
• Counter Set—Select the counter set:
- Set 1—Displays the statistics for Set 1 that contains all interfaces and
queues with a high DP (Drop Precedence).
- Set 2—Displays the statistics for Set 2 that contains all interfaces and
queues with a low DP.
• Interface—Select the ports for which statistics are displayed. The options
are: