


Chapter 3 Element Function|ScrEdit Software User Manual
3-54 Revision Apr. 30th, 2007, 2007PDD23000002
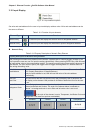
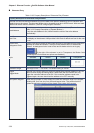
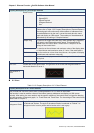
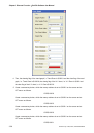
Property Description of Trend Graph Element
Word
Read Format
1. BCD
2. Signed BCD
3. Signed Decimal
4. Unsigned Decimal
5. Hex
Read Address The address can be internal memory or the controller address.
(Please refer to Table 3.2.2 Property Description of General Buttons.)
The trend graph will continuously read numbers of addresses from
the read address set by the user, convert the read data into trend
graph and display on HMI screen. The numbers of the addresses is
determined by the setting of “Sample Number”.
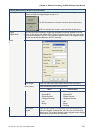
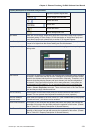
Sample Flag It is used to set trigger and clear flag. When sample flag is triggered,
it will start to read data and draw the graph. This sample flag is
located within the control block. Please refer to Chapter 5 for the
settings of the control block.
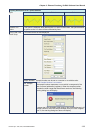
Minimum
Maximum
It is used to set the minimum and maximum value of the display data,
i.e. the minimum and maximum value of Y-axis. If the read value is
more the maximum or less than the minimum, the system will display
the minimum and maximum value still.
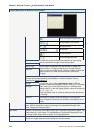
Curve Width It is used to the display curve width. The range is within 1 ~ 8 and the
unit is pixel.
Curve Color It is used to the display curve color.
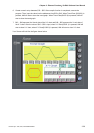
Grid Color
Grid Number in
Horiz.
Please refer to the figure below. The grid color is set to red and the grid number in
horizontal direction is set to 3.
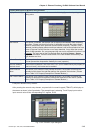
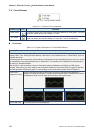
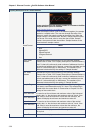
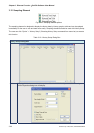
X-Y Chart
Table 3.11.3 Property Description of X-Y Chart Element
Property Description of X-Y Chart Element
HMI will read and convert a series value of setting address to a X-Y chart on the screen.
This function is used to read the values of the internal memory addresses and display on HMI screen
statically. After setting, the user needs to set the specific address of the control block to trigger the drawing
and clear operation of the trend graph, i.e. Trend Draw and Trend Clear. For the settings of the control block,
please refer to Chapter 5.
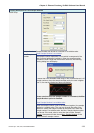
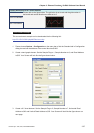
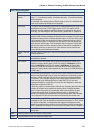
Border Color
Background Color
Border Color option can be set only when the style of the X-Y chart element is selected
as Raised and Sunken. The style of the element below is selected as “Raised”. Its
background color is set to yellow and its border color is set to gray.