


HARSFEN0602
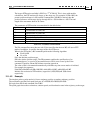
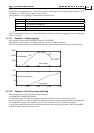
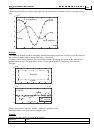
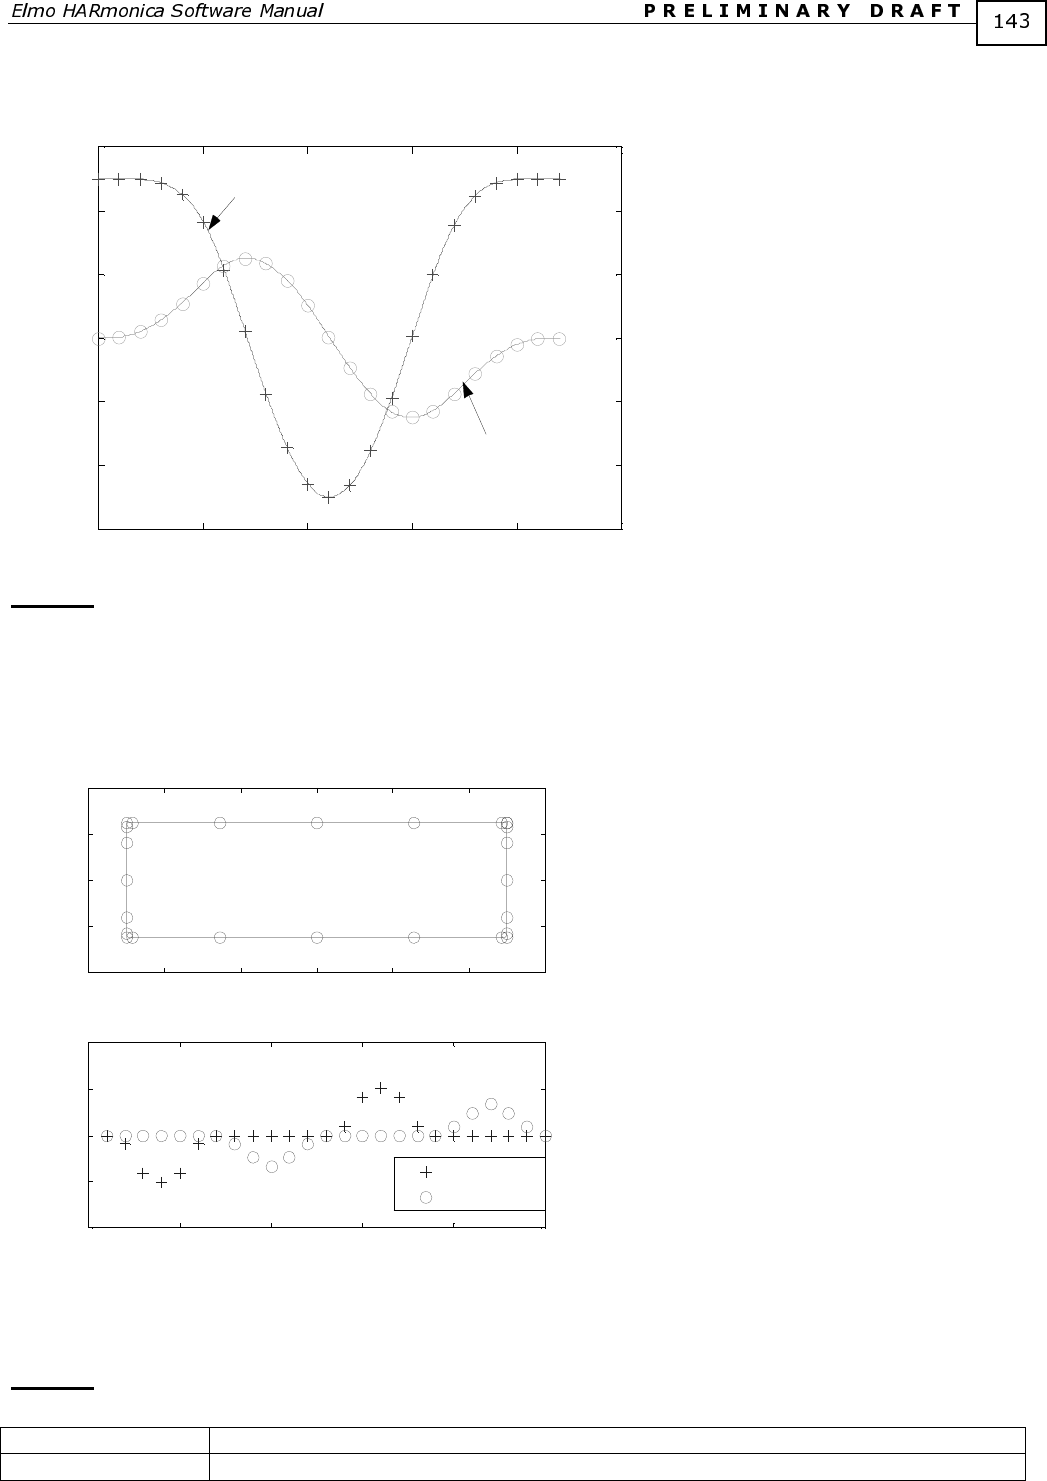
The next figure displays the interpolated trajectories generated by the Amplifiers for the x-axis and for the y-
axis.
0 500 1000 1500 2000 2500
-6
-4
-2
0
2
4
6
x 10
4
msec
Counts
X axis trajectory
Y axis trajectory
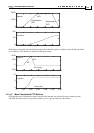
Example
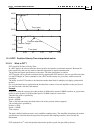
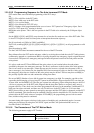
The Amplifier normally produces maximally smooth interpolating trajectories. For this reason, the ellipse of
the previous example could be interpolated using so few points.
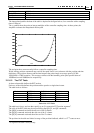
Accurate corners require, however, non-smooth interpolation. Specifying zero speed for the corner points
generates hard corners. The graph below shows a 2-axes synchronized PVT trajectory of an accurate
rectangle.
-3 -2 -1 0 1 2 3
x 10
4
-2
-1
0
1
2
x 10
4
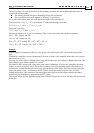
0 5 10 15 20 25
-2
-1
0
1
2
x 10
5
x speed
y speed
Counts/sec
PVT points
Rectangle
Counts
Counts
For the corner points, both the x and the y speeds are specified to zero.
The interpolation error for the entire rectangle is zero.
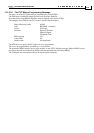
Example
Consider the following PVT interpolation interval:
Parameter Value
Starting position 1000cnt