- The system condition data is not reflected in the display until collection at the fixed intervals shown below is completed.
Check the display after the fixed intervals shown below.
Note that, if the contents are empty after a fixed interval, the connection destination L-Platform may be stopped. Contact the Tenant
Administrator.
Tab name Display period (*) Collection time required before displaying
Total 30 days one whole day (from 0:00 to 23:59)
CPU
Disk
Memory
Network
one hour ten whole minutes (from 0 minutes to 9 minutes)
one day one whole hour (from 0 minutes to 59 minutes)
one month/one year one whole day (from 0:00 to 23:59)
*: The display period in each tab except for Total tab can be selected from one hour, one day, one month, or one year.
- System condition data is not displayed if the power is off at the monitored L-Server.
- If the CPU utilization status continues at 100% at the monitored L-Server, data collection timing may be delayed and an error of about
one second may occur. This may cause CPU utilization (average value for a specified unit of time) to exceed 100%.
Take into account the possibility of data errors when using this display.
Example:
If a monitored L-Server has one CPU and is displayed in units of one hour, the value in the system condition graphs and CSV file data
may be displayed as 100.03% (60.02 minutes (near equal 3601 seconds)/60 minutes) even though the upper limit for CPU utilization
is 100%.
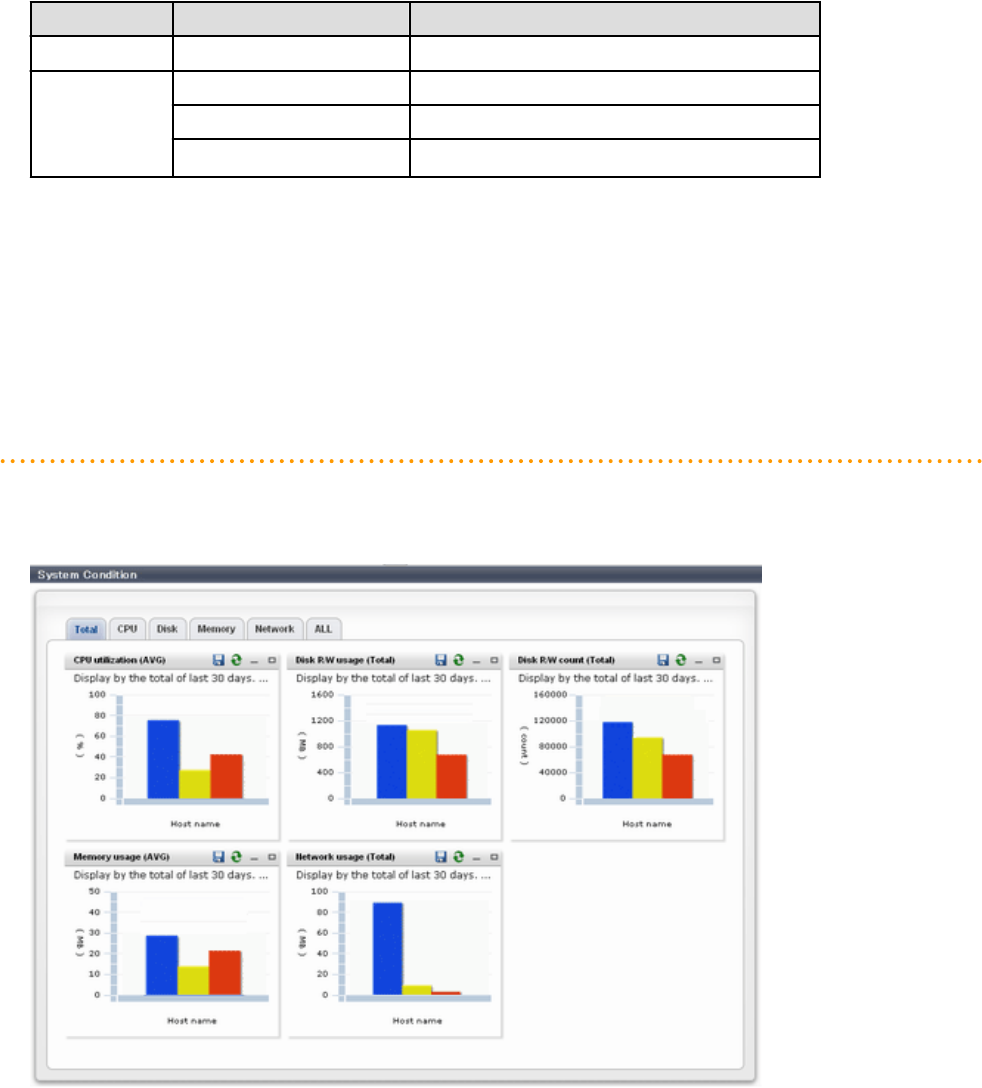
Display examples for the Total tab and the All tab are shown below.
- Total tab
- 15 -


