32
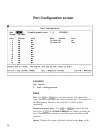
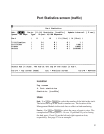
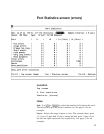
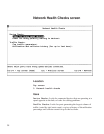
Statistic:
Use
AS
or
z
to select the type of port statistics
you want to view. Errors is the other type of statistic option you can
view. See page 33.
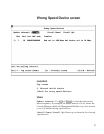
Update interval:
Use
AS
or
z
to select the time period
between updates. For example, an Update interval of 5 sec. means the
Console Manager collects and displays information from the
Management Module every five seconds.
Speed:
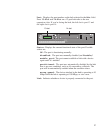
Displays the current speed of the hub in the Hub: field.
Type: Displays the manufacturer-assigned type of hub. You can
change this to whatever you’d like through the System Configuration
screen (see page 17).
% Utilization:
The percentage of Ethernet bandwidth (10 or 100
Mbps) the device attached to that port is using. All hubs in the stack
running at the same speed are in the same collision domain and share
either 10 or 100 Mbps of bandwidth.
Collisions:
The number of collisions detected. Collisions are
normal in an Ethernet network. They tend to rise as network
utilization rises.
Frames:
The number of frames detected without errors. Includes
unicast, broadcast, and multicast frames. Does not include frames
received with frames too long, runt, FCS, or alignment errors.
Octets:
The number of octets (bytes) contained in frames received
that had no errors. This includes octets in unicast, broadcast, and
multicast frames. It also includes octets after the start frame delimiter
up to FCS, but not including FCS octets.
NOTE
Since frames vary in length,
it’s best to look at the octet
count to see how much traffic
is passing through the hubs.


