


44
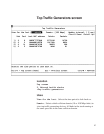
Update interval:
Selects the time period between updates. For
example, an Update interval of 5 sec. means the Console Manager
checks the Management Module every five seconds for updated
information.
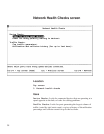
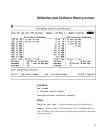
Utilization Breakdown:
Displays the amount of time the
selected collision domain had a utilization percentage in the
particular range. In the example, the 10 Mbps collision domain was
at 0-9% utilization for 41 minutes and 16 seconds.
Collisions/sec Breakdown:
Displays the amount of time the
selected collision domain had a collision per second count in the
particular range. In the example, the 10 Mbps collision domain had
0-5 collisions per second for 37 minutes and 59 seconds.
Total time:
Displays the total amount of time the Management
Module collected the history. If the total time is less than the View
for the last value, then the Management Module or hub was
probably reset or powered off.
Minimum:
Displays the minimum utilization percentage or collision
count for the time period.
Maximum:
Displays the maximum utilization percentage or collision
count for the time period.
Average:
Displays the average utilization percentage or collision
count for the time period.
Interpreting this screen
It’s best to view utilization coupled with collisions before making any
decisions on the saturation of your network. Generally, Ethernet
saturation starts to occur when the utilization reaches 30% and above.
However, if the collision count is low, you don’t have a saturated
network, but an efficient network.
If both the utilization percentage and the collision count are
consistently high (above 30% for utilization and 50-100 collisions/
second or more), then you have a saturated network and will see poor
performance. The best way to alleviate a saturated network is to
segment the network (have fewer devices share a fixed amount of
bandwidth). You can do this by adding a switch to the network.