59
58
Advanced image processing
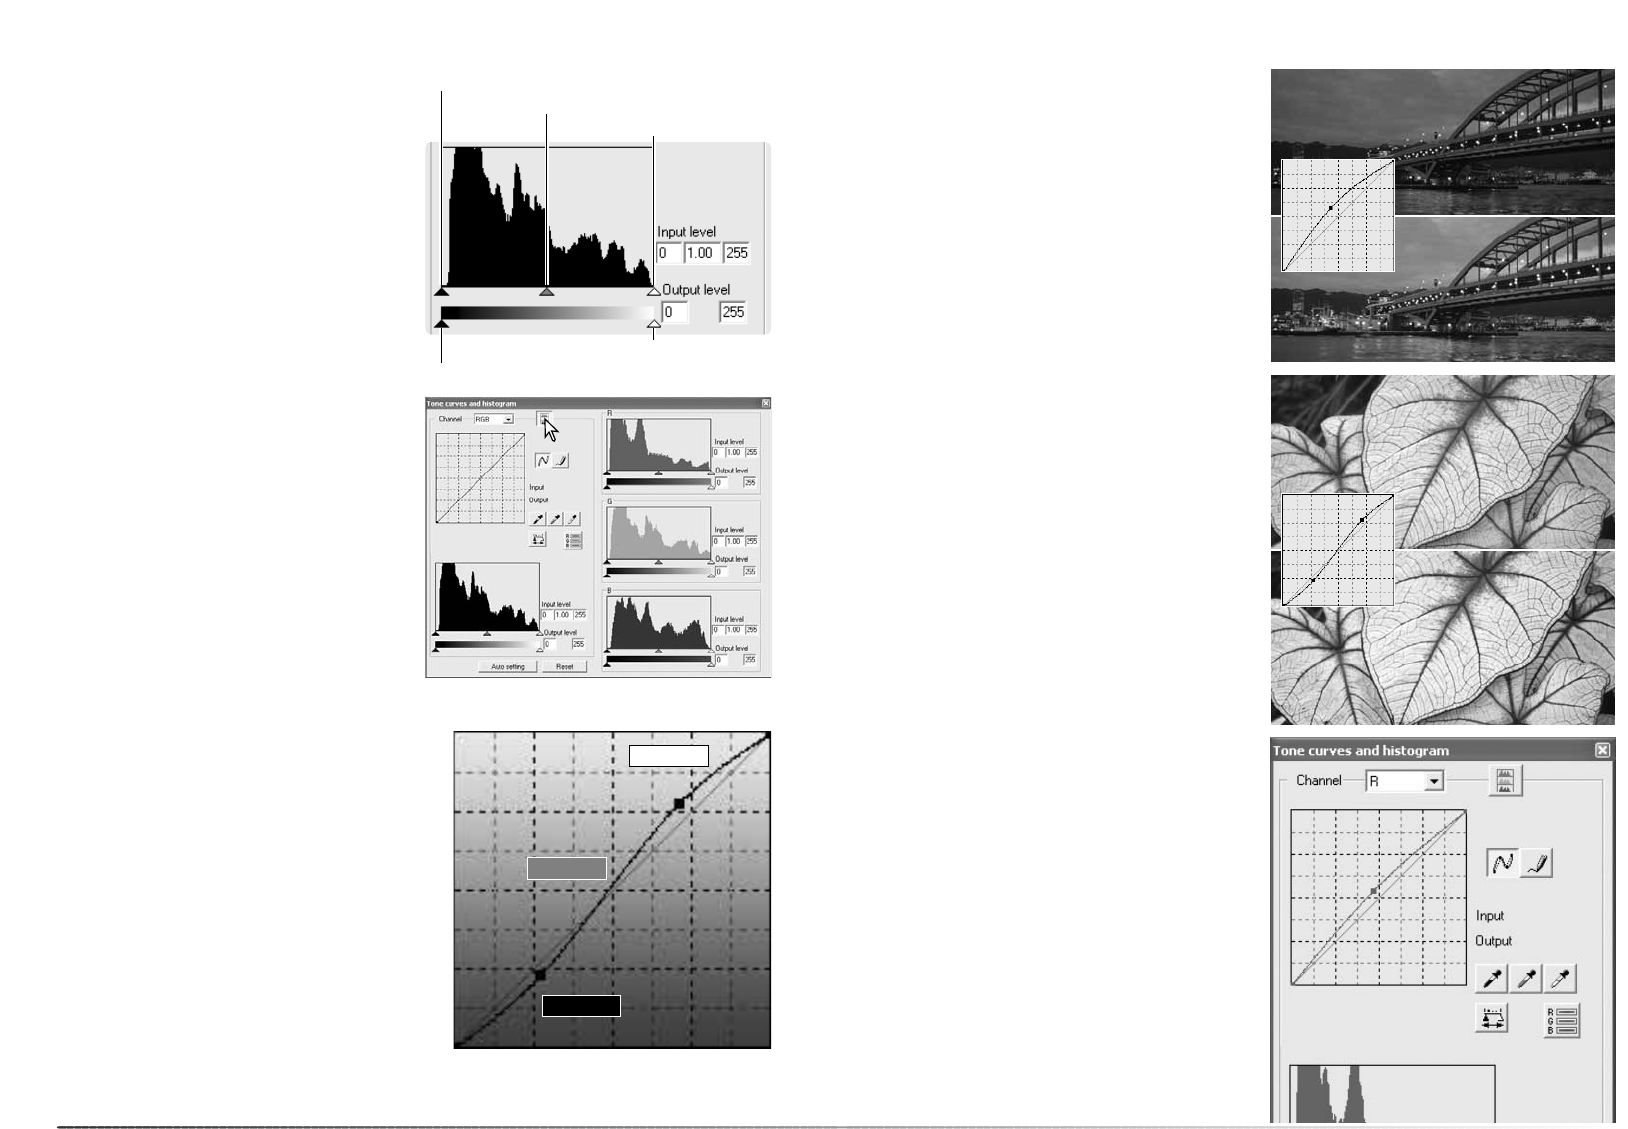
The highlight level, shadow level, and gamma
are set with the sliders under the histogram.
These levels are displayed numerically in the
text boxes to the right of the sliders and can
be changed with the keyboard.
Gamma defines the mid-tones of the image.
The input highlight slider sets the white level.
All pixels to the right of the slider are set to 255
and any image detail they may contain is lost.
The input shadow slider sets the black level. All
pixels to the left of the slider are set to 0 and
any image detail they may contain is lost.
The output levels can be adjusted. By moving
the output highlight and shadow sliders, the
contrast of the image can be reduced.
Click the color-histogram button to view the
red, green, and blue histograms. Click the but-
ton again to hide the display.
Input shadow slider
Input gamma slider
Input highlight slider
Output shadow slider
Output highlight slider
The tone curve is a graphic representation of
the brightness and color levels of the image.
The bottom axis is the 256 levels of the original
image (input data) from black to white. The ver-
tical axis is the corrected image (output data)
with the same scale from top to bottom.
The bottom left portion of the graph represents
the dark colors and shadow areas of the
image. The middle section represents the mid-
tones: skin, grass, blue sky. The top right sec-
tion is the highlights: clouds, lights. Changing
the tone curve can affect the brightness, con-
trast, and color of the image.
Tone-curve processing guide
Input
Output
Highlights
Mid-tones
Shadows
Changing brightness
This is a simple technique to make an image
brighter.
With the RGB channel selected, place the
smooth-curve cursor on the center of the
curve. Click and drag the curve up. Look at the
displayed image to judge the result. The
adjustment can be very small and still have a
significant impact on the image. Moving the
tone curve down makes the image darker.
By selecting individual color channels on the
tone curve, adjustments to the overall color of
an image can be made. If the image is too red,
green, or blue, simply drag the corresponding
color-channel curve down until the color
appears natural. If the color cast is predomi-
nantly one of the secondary colors, cyan,
magenta, or yellow, move the curve of the
complementary color up.
For example, if the image is too cyan, move
the red curve up.
For more on color, see page 39.
The contrast of an image can be changed. The
45° line on the tone-curve graph represents the
original contrast of the image. Making the
angle of the tone curve greater than 45°
increases the contrast. Making the angle less
than 45° reduces contrast.
With the RGB channel selected, click on the
tone curve near the top and bottom to add two
nodes. Slightly move the top node up and the
bottom node down. This increases the angle
of the central portion of the tone curve and
increase the contrast of the image without
making an overall change in image brightness.
Increasing contrast
Correcting color


