


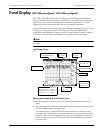
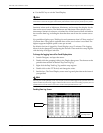
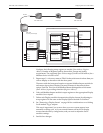


ION 7500 / ION 7600 User’s Guide Trend Display (ION 7500 preconfigured / ION 7600 unconfigured)
Custom Front Panel Displays Technical Note Page 203
◆ Use the ESC key to exit the Trend Display.
NOTE
On the ION 7500 the default Trending parameters displayed are kW sd d-r, Vll, and Iavg. The minimum
and maximum values of the graph automatically scale based on the Ct primary and Pt primary values.
Statistical values such as Minimum, Maximum, and Average also display for the
data at the cursor location. The Minimum and Maximum values display with
timestamps. Statistical values are calculated for all the historical data available in
the associate data log, including the data that does not fit into the current screen
view.
It is possible to display up to 3360 logs for each parameter: that is 35 days worth of
15 minute data. The graph is updated when a new set of values is recorded. The
highest supported update speed is once per second.
By default, the data is logged for Trend Display every 15 minutes. This logging
interval can be changed by configuring the Periodic Timer module’s setup register
with the help of Designer software.
To change the logging interval for Trend Display data:
1. Launch Designer, and open the meter.
2. Double-click the grouping folder in the Display Setup area. The shortcut to the
periodic timer module is labeled "Dsp Trnd Log Trg."
3. Right-click the Dsp Trnd Log Trg module setup register.
4. Double-click on the PT7 Period, and change the value.
5. Send & Save. The Trend Display screen now logs and plots data at the interval
you specified.
NOTE
Currently, the Trending Display screen only accepts synchronous data triggered by a periodic timer. If a
setpoint module asynchronously triggers a data recorder which is set for the trending purposes, then it is
possible that the records drawn in the screen will be unevenly distributed over time.
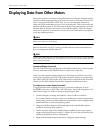
Trending Data Log Screen
Vertical cursor
Click to access the
Trending Graph