


Default Front Panel Display Screens ION 7500 / ION 7600 User’s Guide
Page 28 Chapter 2 - Using The Front Panel
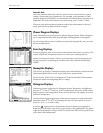
17. Phasors (Phasors)
This screen is a phasor diagram display that shows the magnitude and the
relative angular difference between all phase voltage (V a, V b, V c, V 4) and
current (I a, I b, I c, I 4, I 5) fundamental components.
18. Name Plt (Name Plate Info)
The Name Plate Info screen contains the following information: Owner,
TAG 1
and
TAG 2 from the Factory module, firmware revision of the ION meter, and a
battery life indicator.
TAG 1 and TAG 2 typically identify the meter’s user and
installed location. The Owner and
TAG registers are configurable with the
Designer software.
19. Events (Event Log)
The Event Log display alerts you to events written to the meter’s event log.
D
ATE, TIME, SOURCE, and EVENT information are provided. The up and down
Navigation buttons allow you to move through the list.
20. Setpoint (Setpoint Status)
This numeric display screen displays the status of the setpoint parameters
defined in the Vista Setpoints diagram.
21. Energy2 (Energy Received)
This numeric display screen shows received (exported) energy values for kWh,
kVARh, and kVAh.
22. Demand2 (Demand Received)
This numeric display screen shows received power quantities (kW, kVAR, and
kVA) in the present demand period. By default, these values are from a sliding
window demand (rolling block) calculation.
23. Pk Dmd2 (Peak Demand Rec)
This is a numeric display screen with timestamps. It shows the maximum
received demand quantities (kW, kVAR, and kVA) and the time at which they
were recorded. By default, these values are from a sliding window demand
(rolling block) calculation.
24. THD (Volts and Amps THD)
This numeric display screen contains the total harmonic distortion on all phase
voltage and current inputs.
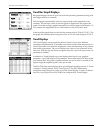
25, 26, 27, 28. V1 Harm, V2 Harm, V3 Harm, V4 Harm (Harmonics)
These four histogram display screens show the harmonic content on the phase
voltage inputs.
29, 30, 31, 32, 33. I1 Harm, I2 Harm, I3 Harm, I4 Harm, I5 Harm (Harmonics)
These five histogram display screens show the harmonic content on the phase
current inputs.
34. TOU (Active Rate / Season)
This eight parameter display screen shows kWh delivered values for each all
four of the possible time of use (TOU) rates (rates A, B, C, and D).