


Chapter 2 Measurement Studio Measurement Computing Edition .NET Class Libraries
Measurement Studio for MCC User Manual 2-12 ni.com
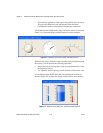
• Copy the graph as a BMP, GIF, JPEG, or PNG image to the clipboard
or a file.
Tip For more information about using the waveform and scatter graph controls, refer to
the Using the Measurement Studio Windows Forms Scatter and Waveform Graph .NET
Controls section in the NI Measurement Studio Help.
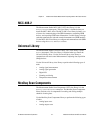
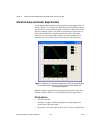
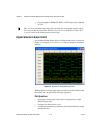
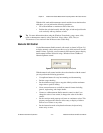
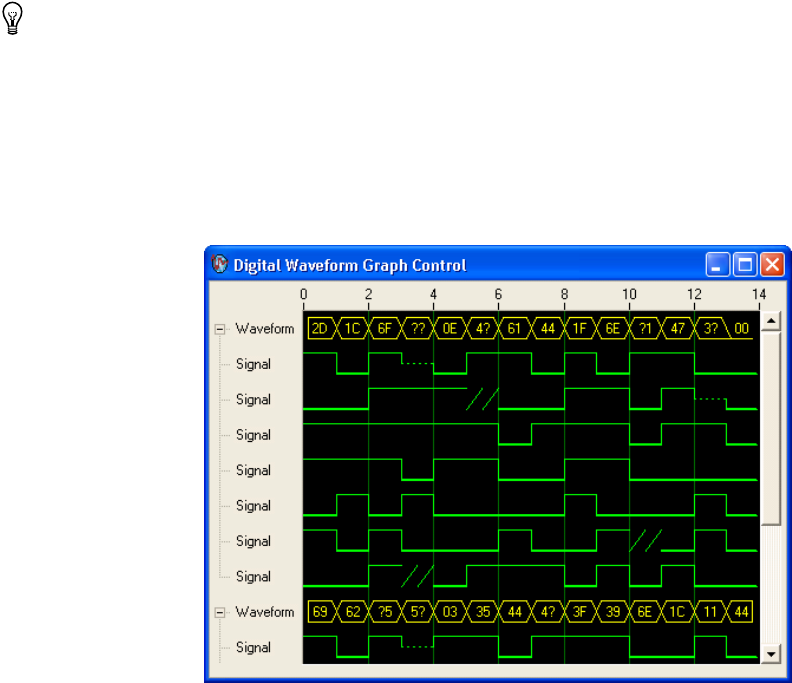
Digital Waveform Graph Control
Use the Measurement Studio digital waveform graph control, as shown in
Figure 2-2, to display
DigitalWaveform data on a Windows Forms user
interface.
Figure 2-2. Windows Forms Digital Graph Control
With the digital waveform graph control and the classes that interface with
the control, you can perform the following operations:
Plot Operations
• Plot digital waveform data. Data values can represent up to eight
different digital states.
• Configure plot labels on the y-axis.
• Configure plot templates to customize plots that are implicitly created
from plotted data.