


Chapter 2 Measurement Studio Measurement Computing Edition .NET Class Libraries
© National Instruments Corporation 2-13 Measurement Studio for MCC User Manual
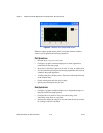
• Specify anti-aliased digital plots.
• Expand and collapse signal plots interactively.
Waveform Sample and Signal State Operations
• Simultaneously display waveforms and signals or display signals only.
• Create custom waveform sample and signal state styles.
• Configure sample and state labels.
• Create custom waveform sample and signal state labels.
Axis Operations
• Configure the axis modes to fixed, exact autoscaling, or loose
autoscaling.
• Interactively change the range of an axis and invert the axis at run time
by clicking on the axis end labels.
Additional Operations
• Display data in sample or time mode.
• Pan with scroll bars.
• Configure the style and mode of scroll bars.
• Create custom scroll bars.
• Pan and zoom interactively.
• Configure major, minor, and custom divisions.
• Copy the graph as a BMP, GIF, JPEG, or PNG image to the clipboard
or a file.
Tip For more information about using the digital waveform graph control, refer to the
Using the Measurement Studio Windows Forms Digital Waveform Graph .NET Control
section in the NI Measurement Studio Help.
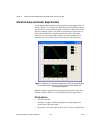
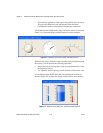
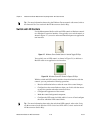
Complex Graph Control
Use the Measurement Studio complex graph control, as shown in
Figure 2-3, to display
ComplexDouble data on a Windows Forms user
interface. A
ComplexDouble consists of a real part and an imaginary part.