


Chapter 2 Measurement Studio Measurement Computing Edition .NET Class Libraries
Measurement Studio for MCC User Manual 2-14 ni.com
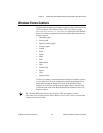
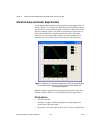
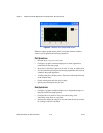
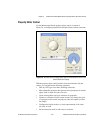
Figure 2-3. Windows Forms Complex Graph Control
With the complex graph control and the classes that interface with the
control, you can perform the following operations:
Plot Operations
• Plot and chart ComplexDouble data.
• Configure a graph to contain multiple plots to show separate but
related data on the same graph.
• Draw lines or fills from a plot to an X value, Y value, or another plot.
• Use the extensible plot and plot area drawing capabilities and events to
customize the graph appearance.
• Configure the plot to display arrows. The arrows indicate the direction
of the complex data.
• Create custom point and line styles for plots.
• Specify anti-aliased plots for plot lines.
Axis Operations
• Configure a graph to include multiple axes or independent ranges so
that plot data fits the graph plot area.
• Configure the axis modes to fixed, exact autoscaling, loose
autoscaling, strip chart, or scope chart.
• Interactively change the range of an axis and invert the axis at run time
by clicking on the axis end labels.