


Chapter 2 Measurement Studio Measurement Computing Edition .NET Class Libraries
© National Instruments Corporation 2-25 Measurement Studio for MCC User Manual
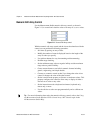
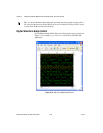
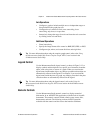
• Specify plots in the scatter graph control as X and Y data. Specify plots
in the waveform graph control as X or Y data and optionally with date
and time scaling.
• Use the extensible plot and plot area drawing capabilities and events to
customize the graph appearance.
• Create custom point and line styles for plots.
• Specify anti-aliased plots for plot lines.
Axis Operations
• Configure a graph to include multiple axes or independent ranges so
that plot data fits the graph plot area.
• Configure the axis modes to fixed, exact autoscaling, loose
autoscaling, strip chart, or scope chart.
• Use logarithmic axes with configurable bases.
• Interactively change the range of an axis and invert the axis at run time
by clicking on the axis end labels.
Cursor Operations
• Use cursors to identify key points in plots and the plot area.
• Configure cursor snap modes to be floating, nearest point, or to plot.
• Use cursor labels to display X and Y data coordinates that the cursor
crosshair points to, and customize the text font and colors of the label.
• Create custom point and line styles for cursors.
Annotation Operations
• Configure text labels, arrows, and drawing shapes to annotate a point
anywhere in the plot area of the graph.
• Configure range area, text labels, and arrows to annotate a range in the
plot area of the graph.
Additional Operations
• Zoom interactively.
• Specify the image format of the control as BMP, GIF, JPEG, or PNG.
• Configure major, minor, and custom divisions and origin lines.