


Chapter 4 Getting Started with Measurement Studio
© National Instruments Corporation 4-7 Measurement Studio for MCC User Manual
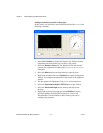
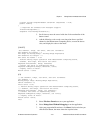
// Use the PlotY method to plot the data.
Plot.PlotY(data);
// Use the Mean method to calculate the mean of the data.
double mean = Statistics.Mean(data);
// Display the mean on the gauge.
gauge.Value = mean;
Customizing your user interface
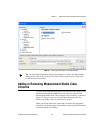
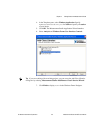
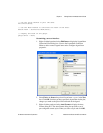
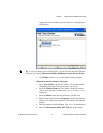
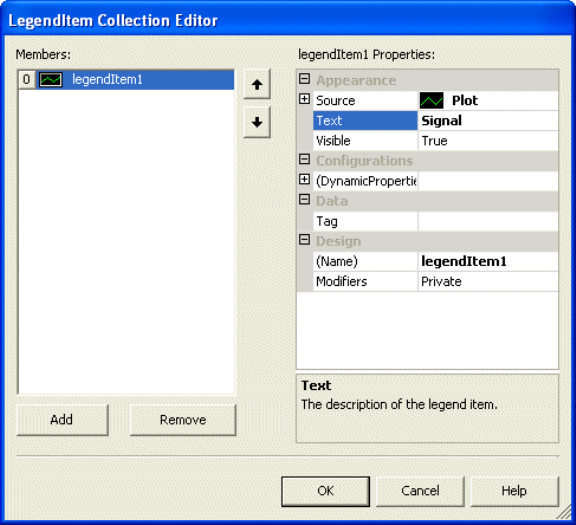
1. Right-click the legend and select Edit Items to display the LegendItem
Collection Editor dialog box. You use the LegendItem Collection
Editor to add or remove legend items and to configure legend item
properties.
2. Select Plot in the Source drop-down list and enter
Signal in the Text
box. Click OK. Now that you have specified a legend item for the plot,
changes you make to the plot will be reflected on the legend.
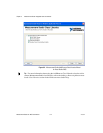
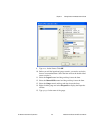
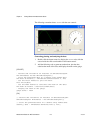
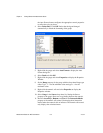
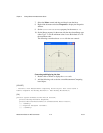
3. Right-click the graph and select Auto Format to display the Auto
Format dialog box. The Auto Format dialog box provides a set of
pre-configured control styles. When you select a style and click OK,