


Chapter 2 Measurement Studio Measurement Computing Edition .NET Class Libraries
© National Instruments Corporation 2-29 Measurement Studio for MCC User Manual
Axis Operations
• Configure a graph to include multiple axes or independent ranges so
that plot data fits the graph plot area.
• Configure the axis modes to fixed, exact autoscaling, loose
autoscaling, strip chart, or scope chart.
• Interactively change the range of an axis and invert the axis at run time
by clicking on the axis end labels.
Additional Operations
• Zoom interactively.
• Specify the image format of the control as BMP, GIF, JPEG, or PNG.
• Configure major, minor, and custom divisions and origin lines.
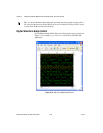
Tip For more information about using the complex graph control, refer to the Using
the Measurement Studio Web Forms Complex Graph .NET Control section in the
NI Measurement Studio Help.
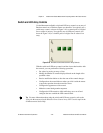
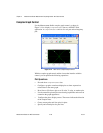
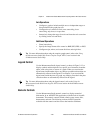
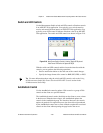
Legend Control
Use the Measurement Studio legend control, as shown in Figure 2-12, to
display symbols and descriptions for a specific set of elements of another
object, such as the plots or cursors of a graph. When you associate the
legend control with another object, any changes you make to that object are
automatically reflected in the legend. For example, if you associate the
legend control with the plots of a graph, any changes you make in the plots
collection editor are automatically reflected in the legend.
Tip For more information about using the legend control, refer to the Using the
Measurement Studio Web Forms Legend .NET Control section in the NI Measurement
Studio Help.
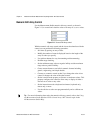
Numeric Controls
Use the Measurement Studio numeric controls to display numerical
information, in an ASP.NET Web application, with the look of scientific
instruments. The numeric controls include a knob, gauge, meter, slide,
thermometer, and tank. The following sections describe operations
available with the controls and the classes that interface with them.