


Chapter 4 Getting Started with Measurement Studio
Measurement Studio for MCC User Manual 4-26 ni.com
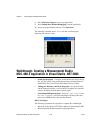
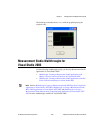
Walkthrough: Creating a Measurement Studio
Application with Windows Forms Controls and Analysis
in Visual Studio 2005
Measurement Studio includes user interface controls, such as a waveform
graph control and a gauge control, and analysis functionality such as signal
generation and mathematical functions. This walkthrough is designed to
help you learn how to add analysis and presentation functionality to a
Windows Forms application by taking you through the following steps:
• Setting up the project—Using the Measurement Studio Application
Wizard, you will create a new project that references the Measurement
Studio Analysis class library and Windows Forms controls.
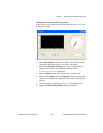
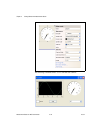
• Adding user interface controls to the project—Using the Toolbox,
smart tags, and the Properties window, you will add and configure a
button, waveform graph, legend, gauge, and numeric edit user
interface control.
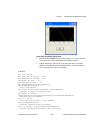
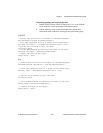
• Generating, plotting, and analyzing the data—Using
NationalInstruments.Analysis.SignalGeneration.White
NoiseSignal
and
NationalInstruments.Analysis.Math.Statistics.Mean,
you will generate data, plot the generated data on a waveform graph,
and calculate the mean of the data.
• Customizing the user interface—Using smart tags and the Collection
Editor and Auto Format dialog boxes, you will display the mean value
on the gauge and the numeric edit, as well as customize your user
interface.
Before You Begin
The following components are required to complete this walkthrough:
• Microsoft Visual Studio 2005
• Measurement Studio Measurement Computing Edition
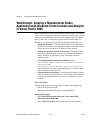
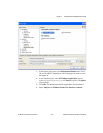
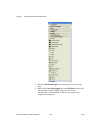
Setting up the project
1. Select Start»All Programs»Microsoft Visual Studio 2005»
Microsoft Visual Studio 2005.
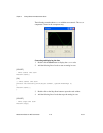
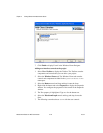
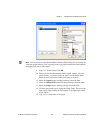
2. Select File»New»Project. The New Project dialog box launches.