


Chapter 4 Getting Started with Measurement Studio
Measurement Studio for MCC User Manual 4-44 ni.com
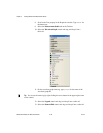
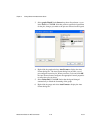
3. Select graph, Plots[0] in the Source drop-down list and enter Signal
in the Text box. Click OK. Now that you have specified a legend item
for the plot, changes you make to the plot are reflected on the legend.
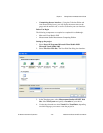
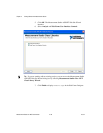
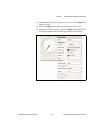
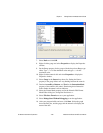
4. Right-click the graph and select Auto Format to display the Auto
Format dialog box. The Auto Format dialog box provides a set of
pre-configured control styles. When you select a style and click OK,
the Auto Format feature configures the appropriate control properties
to reflect the style you chose.
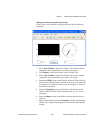
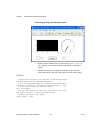
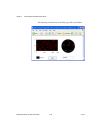
5. Select Points Only. Click OK. Notice that the legend changed
automatically to match the formatting of the graph.
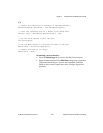
6. Right-click the gauge and select Auto Format to display the Auto
Format dialog box.