


Chapter 2 Measurement Studio Measurement Computing Edition .NET Class Libraries
Measurement Studio for MCC User Manual 2-24 ni.com
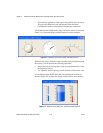
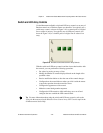
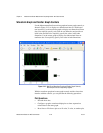
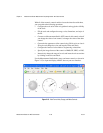
Waveform Graph and Scatter Graph Controls
Use the Measurement Studio waveform graph and scatter graph controls, as
shown in Figure 2-12, to display two-dimensional data on a Web-based
user interface. Use the waveform graph to display two-dimensional linear
data. You explicitly specify each value in one dimension and provide an
initial value and interval to implicitly specify the values in the other
dimension. Use the scatter graph to display two-dimensional linear or
nonlinear data. You explicitly specify each value in both dimensions.
Figure 2-12. Web Forms Waveform Graph and Scatter Graph Controls;
Both Graphs Have Corresponding Legends
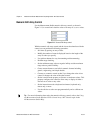
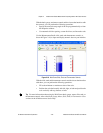
With the waveform graph and scatter graph controls and the classes that
interface with the controls, you can perform the following operations:
Plot Operations
• Plot and chart data.
• Configure a graph to contain multiple plots to show separate but
related data on the same graph.
• Draw lines or fills from a plot to an X value, Y value, or another plot.