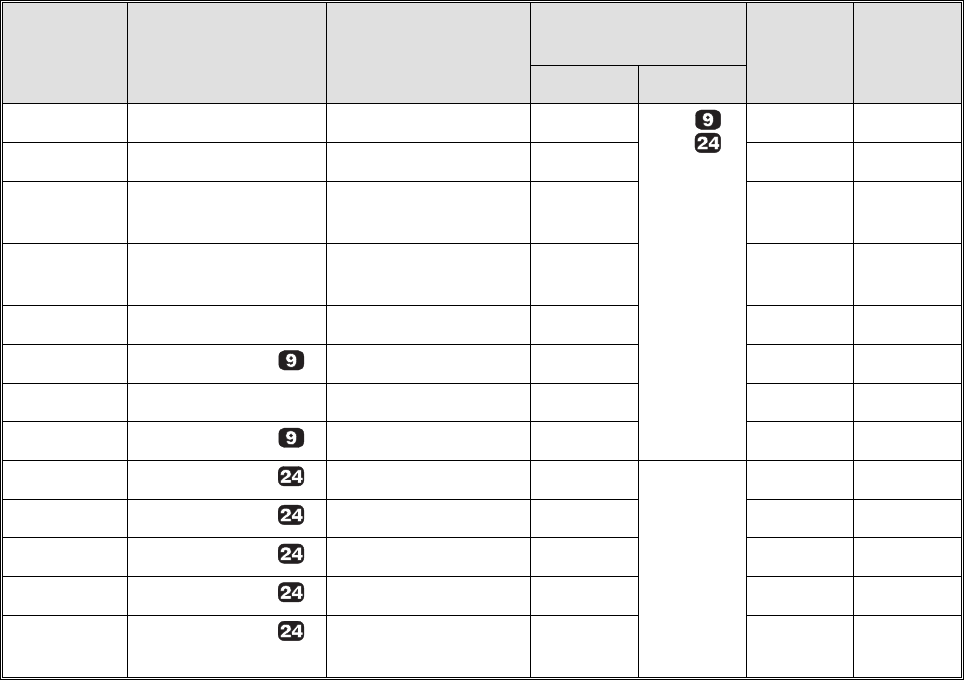
Special
8 Point
Sequences
ESC * <m> ...
-Sequences
Print Mode
Density in dpi
(Dots per Inch)
Needles
in use
Adja-
cent
Dots
horizont. vertic.
ESC K... ESC * <0>... single density 60 72
60
8 possible
ESC L... ESC * <1>... double density 120 8 possible
ESC Y... ESC * <2>... double density/
high speed
120 8 not
possible
ESC Z... ESC * <3>... quadruple density 240 8 not
possible
– ESC * <4>... screen graphics 80 8 possible
– ESC * <5>... plot (1:1) 72 8 possible
– ESC * <6>... screen graphics II 90 8 possible
– ESC * <7>... plot (double density) 144 8 possible
– ESC * <32>... single density 60 180 24 possible
– ESC * <33>... double density 120 24 possible
– ESC * <38>... screen graphics II 90 24 possible
– ESC * <39>... triple density 180 24 possible
– ESC * <40>... sixfold density 360 24 not
possible
Example for Calculation of n
1
and n
2
:
The number of graphics data columns is 80.
n
2
= number of data divided by 256 n
1
= rest of division of n
2
=
80
⁄
256
= dec.80
= dec.0 = hex.50
= hex.00
64
Graphics
