


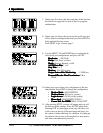

4-18
4 Operations4 Operations
4 Operations4 Operations
4 Operations
TELEDYNE ANALYTICAL INSTRUMENTS
Note:Note:
Note:Note:
Note:
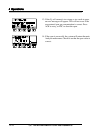
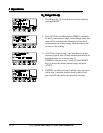
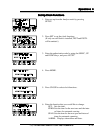
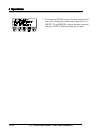
The above screens use T to indicate two values: seconds and minutes. The first value isThe above screens use T to indicate two values: seconds and minutes. The first value is
The above screens use T to indicate two values: seconds and minutes. The first value isThe above screens use T to indicate two values: seconds and minutes. The first value is
The above screens use T to indicate two values: seconds and minutes. The first value is
the time period between samples on the logger, and is programmable. The second timethe time period between samples on the logger, and is programmable. The second time
the time period between samples on the logger, and is programmable. The second timethe time period between samples on the logger, and is programmable. The second time
the time period between samples on the logger, and is programmable. The second time
value is the width of the logger chart page, and is not programmable. There are 64value is the width of the logger chart page, and is not programmable. There are 64
value is the width of the logger chart page, and is not programmable. There are 64value is the width of the logger chart page, and is not programmable. There are 64
value is the width of the logger chart page, and is not programmable. There are 64
samples per logger chart page, and over 20 pages of past data which may be viewed.samples per logger chart page, and over 20 pages of past data which may be viewed.
samples per logger chart page, and over 20 pages of past data which may be viewed.samples per logger chart page, and over 20 pages of past data which may be viewed.
samples per logger chart page, and over 20 pages of past data which may be viewed.
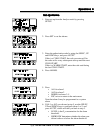
ModeMode
ModeMode
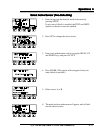
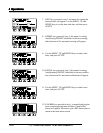
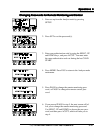
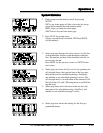
Mode determines how to calculate the sample values shown on the logger chart:
AverageAverage
AverageAverage
Average: The average of all measurements in the time period between samples.
MedianMedian
MedianMedian
Median: The average of the minimum and the maximum values measured in the time
period between samples.
MaximumMaximum
MaximumMaximum
Maximum: The maximum of all values measured in the time period between samples.
MinimumMinimum
MinimumMinimum
Minimum: The minimum of all values measured in the time period between samples.
SampleSample
SampleSample
Sample: The last sample measured in the time period between samples.
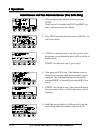
Press EDIT in step 6 and then use the UP and DOWN keys to select the above choices for the
logger chart mode.