


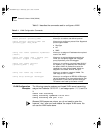

Overview of Virtual LANs 5-7
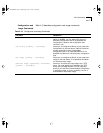
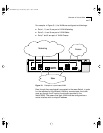
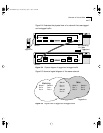
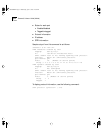
Figure 5-4 illustrates the physical view of a network that uses tagged
and untagged traffic.
Figure 5-4 Physical diagram of tagged and untagged traffic
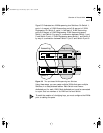
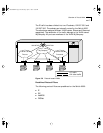
Figure 5-5 shows a logical diagram of the same network.
Figure 5-5 Logical view of tagged and untagged traffic
Switch 1
Switch 2
= Marketing
= Sales
M
S
= Tagged port
M S
M S
M S
MM
S
S
M
M
802.1Q
Tagged server
S
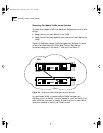
*Tagged Ports
Sales
Switch 1
Port 1
Port 6
Switch 1
Port 1 *
Port 7 *
Switch 2
Port 7
Port 8
Switch 2
Port 2 *
Marketing
Switch 1
Port 2
Port 4
Switch 2
Port 1
Port 4
SW9000.BK Page 7 Wednesday, April 1, 1998 11:00 AM