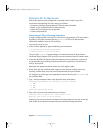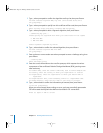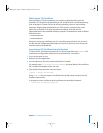
126 Chapter 12 Working With Web Technologies
Viewing Service Statistics
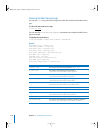
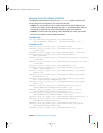
You can use the serveradmin getHistory command to display a log of periodic
samples of the number of requests, cache performance, and data throughput. Samples
are taken once each minute.
To list samples:
$ sudo serveradmin command
qtss:command = getHistory
qtss:variant = statistic
qtss:timeScale = scale
Control-D
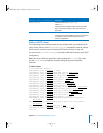
Output
web:nbSamples = <samples>
web:samplesArray:_array_index:0:v
n
= <sample>
web:samplesArray:_array_index:0:t = <time>
web:samplesArray:_array_index:1:v
n
= <sample>
web:samplesArray:_array_index:1:t = <time>
[...]
web:samplesArray:_array_index:
i
:v
n
= <sample>
web:samplesArray:_array_index:
i
:t = <time>
web:v
n
Legend = "<legend>"
web:currentServerTime = <servertime>
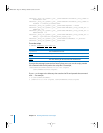
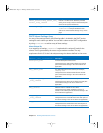
Parameter Description
statistic
The value you want to display. Valid values:
v1 - number of requests per second
v2 - throughput (bytes/sec)
v3 - cache requests per second
v4 - cache throughput (bytes/sec)
scale
The length of time in seconds, ending with the current time, for
which you want to see samples. For example, to see 30 minutes of
data, you would specify qtss:timeScale = 1800.
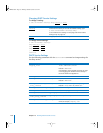
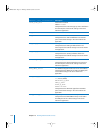
Value displayed by getHistory Description
<samples> The total number of samples listed.
<legend> A textual description of the selected statistic.
"REQUESTS_PER_SECOND" for v1
"THROUGHPUT" for v2
"CACHE_REQUESTS_PER_SECOND" for v3
"CACHE_THROUGHPUT" for v4
<sample> The numerical value of the sample.
<time> The time at which the sample was measured. A standard UNIX time
(number of seconds since Sep 1, 1970.) Samples are taken every 60
seconds.
LL2354.book Page 126 Monday, October 20, 2003 9:47 AM


