


20090601
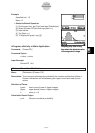
Example
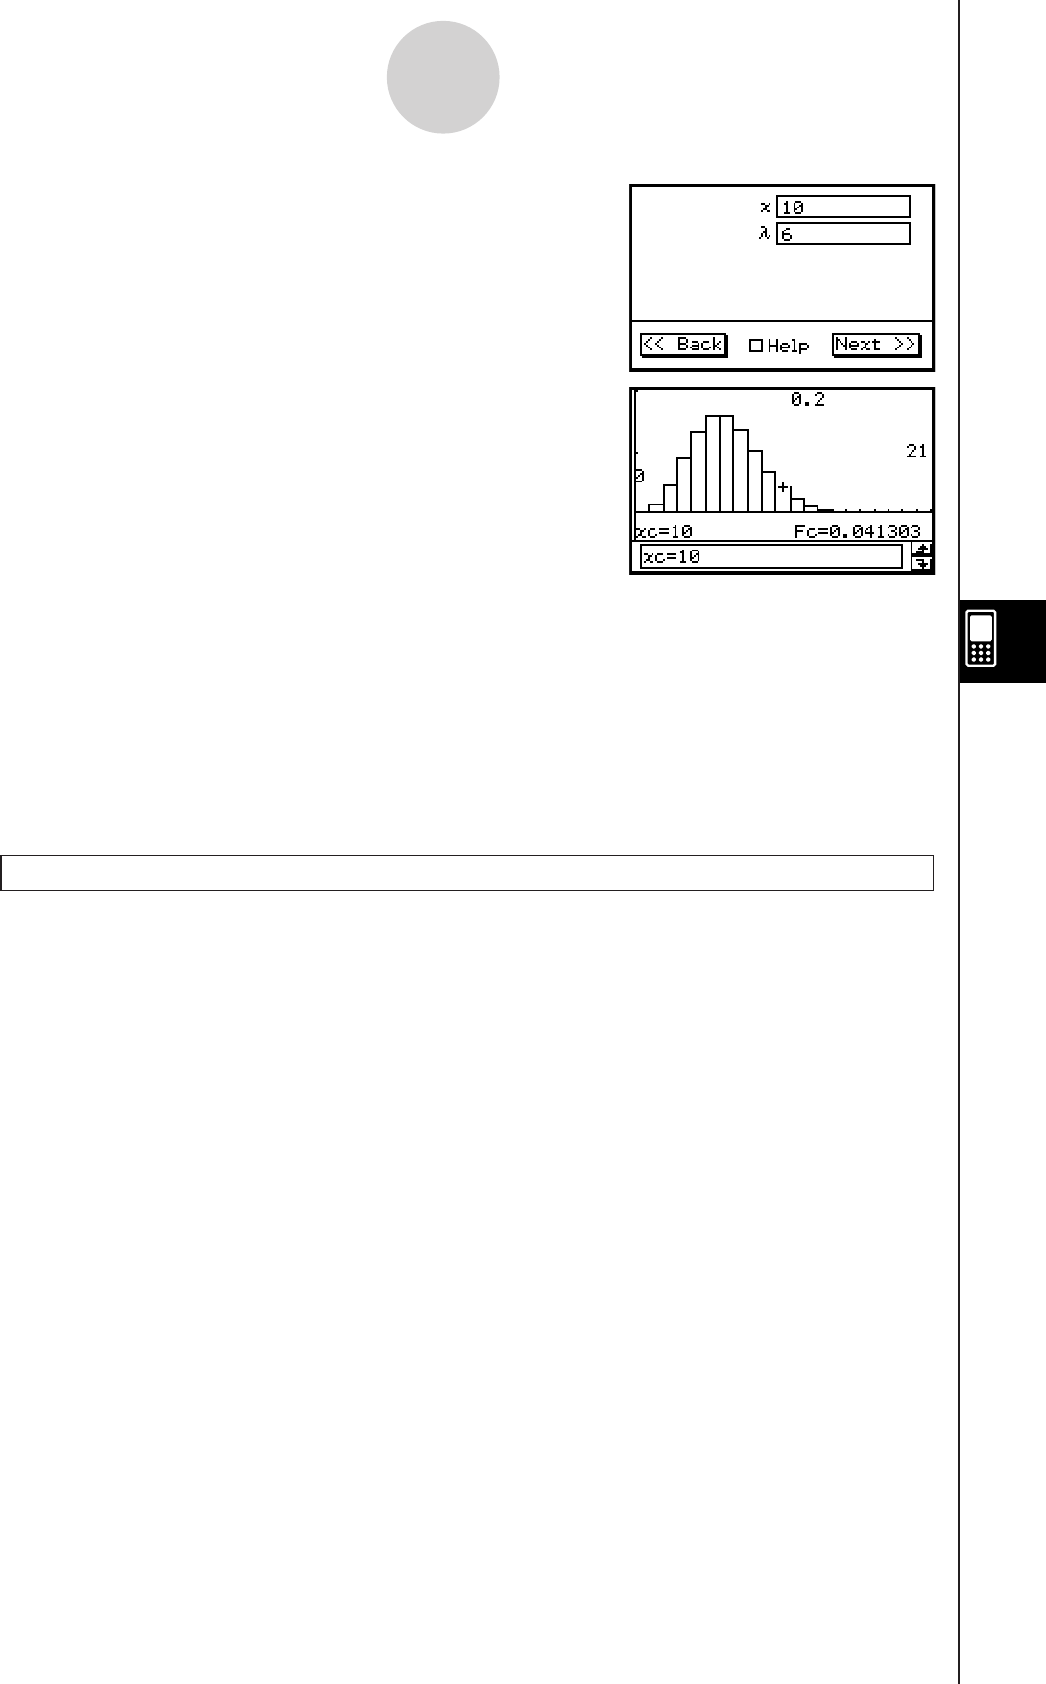
Specified trial : 10
Mean : 6
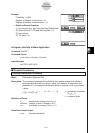
• Statistics Wizard Operation
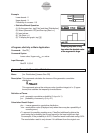
(1) On the menu bar, tap [Calc] and then [Distribution].
(2) Select [Poisson PD] and then tap [Next >>].
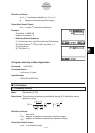
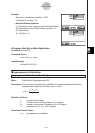
(3) Input values.
(4) Tap [Next >>].
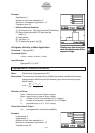
(5) To display the graph, tap
$
.
u
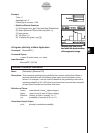
Program, eActivity or Main Application
Command: PoissonPD
Ⅺ
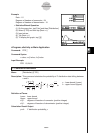
Command Syntax
x
value,
value
Input Example:
PoissonPD 10,6
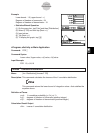
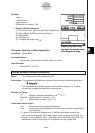
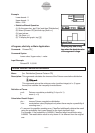
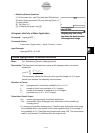
Poisson Cumulative Distribution
Menu: [Distribution]-[Poisson CD]
Description: This command calculates the probability the random variable that follows a
Poisson distribution will fall between given upper bound and lower bound
values.
Definition of Terms
Lower : lower bound (Lower
<
Upper integer)
Upper : upper bound (Lower
<
Upper integer)
: mean (
> 0)
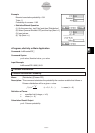
Calculation Result Output
prob
: Poisson cumulative probability
Graphing may take a long
time when the absolute value
of the argument is large.
Graphing may take a long
time when the absolute value
of the argument is large.
7-11-18
Distributions